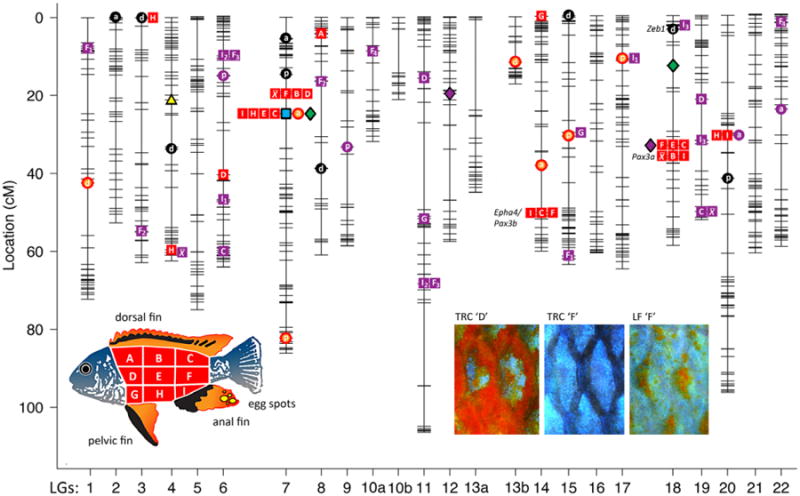
Fig. 2.

Quantitative trait locus (QTL) plot for various melanocyte- and xanthophore-based colour traits. Symbols depict traits mapped to the nearest marker. Circles represent fin traits, whereas squares represent flank traits. Orange/red circles and squares represent xanthophore-based colour. Black circles represent melanocyte-based colour. For fins, ‘a’ is the anal fin, ‘d’ is the dorsal fin, and ‘p’ is the pelvic fin. For the flank, ‘A’–‘I’ represent xanthophore-based colour variation within particular regions along the flank, as indicated in the lower left panel, while × represents average xanthophore-based colour across all flank regions. The yellow triangle indicates the QTL position for egg-spot number. The blue square indicates the QTL for sex determination. Green diamonds indicate the QTL positions for the magnitude of integration for colour traits. All purple symbols indicate epistatic interactions between loci. Subscripts are used when single traits have multiple two-way interactions. Select candidate loci are depicted to the left of their respective markers and discussed in the text. Representative scales of adult male TRC (regions ‘D’ and ‘F’) and LF (region ‘F’) are depicted to the lower right. Region ‘D’ is characterized by extensive R-Y pigmentation in TRC males (region ‘D’ in LF males looks identical to region ‘F’). Region ‘F’ is characterized by diffuse R-Y coloration in LF males and little to no R-Y pigmentation in TRC males.
