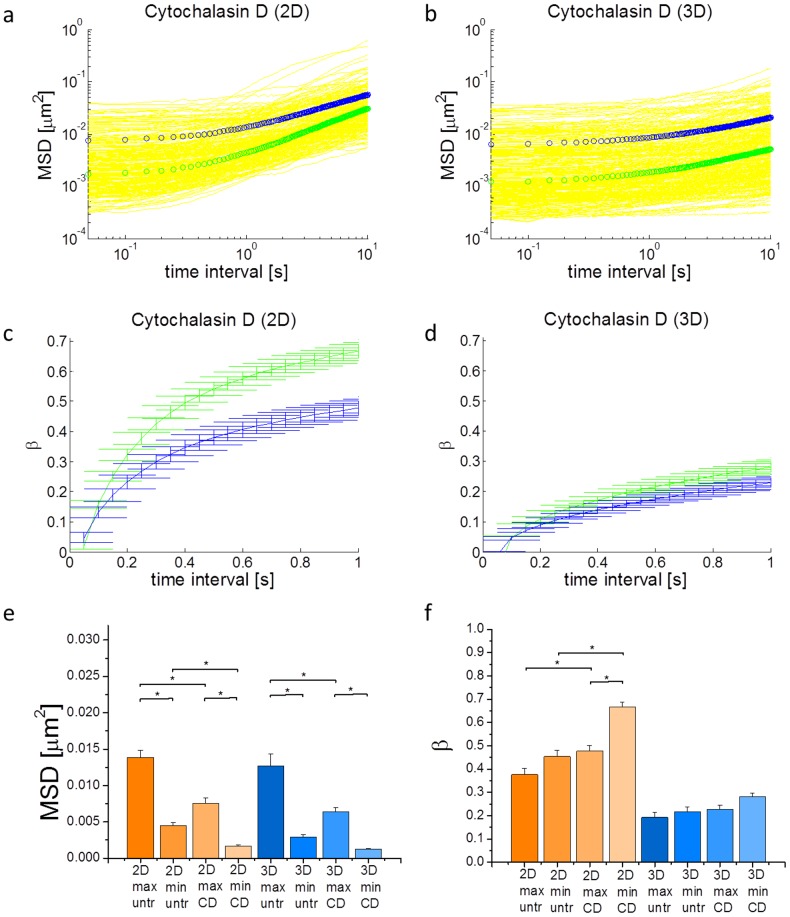
Figure 4. Cytochalasin D treated cells in 2D and 3D.
a,b) MSDs of cells treated with Cytochalasin D in (a) 2D and (b) 3D. c,d) β's of cells treated with Cytochalasin D in (c) 2D and (d) 3D. e) Comparison of MSDs at 50 ms of untreated and Cytochalasin D treated cells in 2D and 3D. f) Comparison of β's at 1s of untreated and Cytochalasin D treated cells in 2D and 3D. Max and min indicate the 1D direction of maximum and minimum fluctuations, respectively. “untr” and “CD” indicate untreated and Cytochalasin D treated cells, respectively. Cells in 2D exhibit a more pronounced effect under treatment than cells in 3D. Error bars are s.e.m. * indicates p<0.05. The color code in (a) and (b) is the same as in Figure 2b.

