
Figure 7. Simulated MSDs and β's for 2D and 3D systems using the effective temperature model to account for active stress fluctuations.
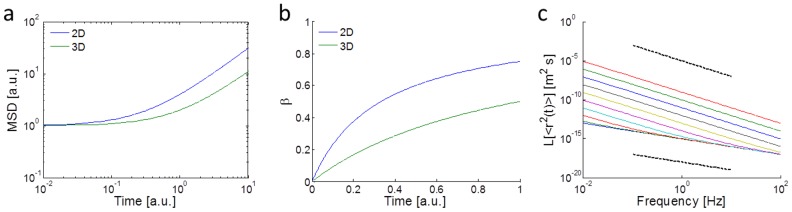
a,b) Simulated (a) MSDs and (b) corresponding β's for cells in 2D (blue) and 3D (green). Cells in 2D have a larger stress fluctuation term A (3 times larger in this case). c) The Laplace transform of the MSDs based on the effective temperature model for different A's (from 0.001 to 106 [1/s]) and fixed s0 = 0.001 Hz. The simulations in (c) assume an elastic material (G is constant and equal to 20 Pa) with 70 nm-radius tracer particles at T = 300 K and power-law trends are attributed to the effective temperature. The bottom and top dotted lines have slopes of 1 and 2, indicating thermal and super-thermal (with motor activity) spectral trends, respectively.