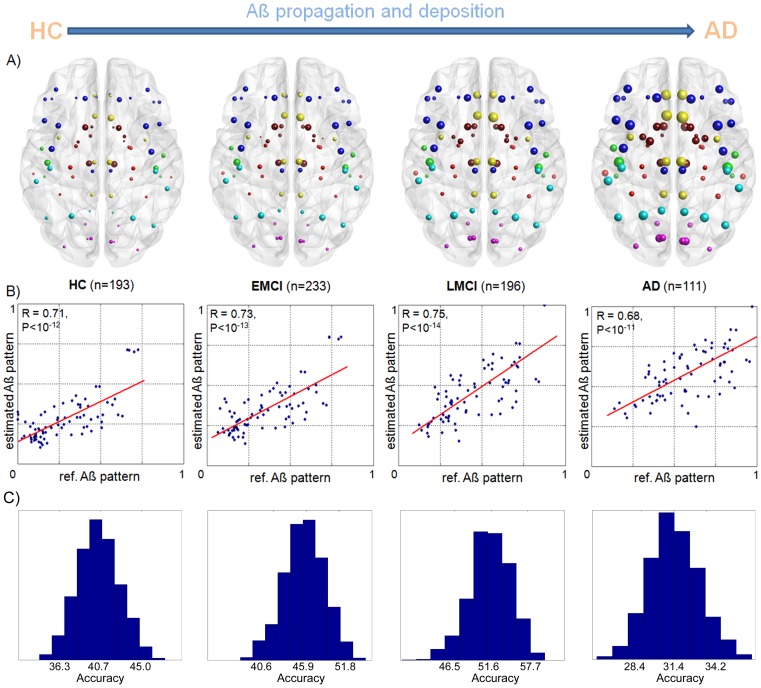
Figure 2. Characteristic regional Aß deposition patterns in healthy and pathologic brains.
A) PET-based mean regional Aß deposition probabilities (adjusted by age, gender, and educational level) in HC, EMCI, LMCI and AD groups. Nodes correspond to 78 regions covering all the brain's gray matter, with node sizes proportional to the associated Aß burden. Note the progressive expansion of the Aß deposition, starting mainly from DMN regions to the rest of the brain. This supports the development of an abnormal Aß deposition pattern in correspondence with the disease progression (from HC to advanced AD clinical states). B) Correspondence between the estimated and PET-based mean regional Aß deposition probabilities for the different groups. C) Prediction accuracy distributions obtained for the different groups (via a repeated random sub-sampling cross-validation procedure).

