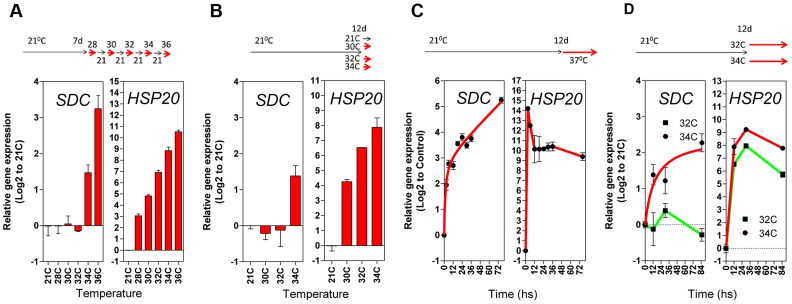
Figure 3. Transcriptional patterns of SDC expression under heat compared to a typical heat-shock gene.
A and B, Thermal threshold of transcriptional activation for SDC and HSP20. A, Seedlings were grown under standard conditions for 7 days and then subjected to daily increases in temperature. B, Seedlings were grown under standard conditions for 12 days and then subjected to a one-step increase in temperature for 12 h. C and D, Heat time-course for transcript levels of SDC and HSP20. C, Seedlings were grown under standard condition for 7 days and then subjected to constant heat for at least 74 h. D, Seedlings were grown under standard condition for 12 days and then subjected to a one-step increase in temperature to a constant 32°C or 34°C. Bars and dots represent the means ± SE as a log2 ratio with the non-treated control conditions (i.e., control = 0); replicated samples were pooled from 40–60 seedlings. In all cases, the experimental design is shown at the top.

