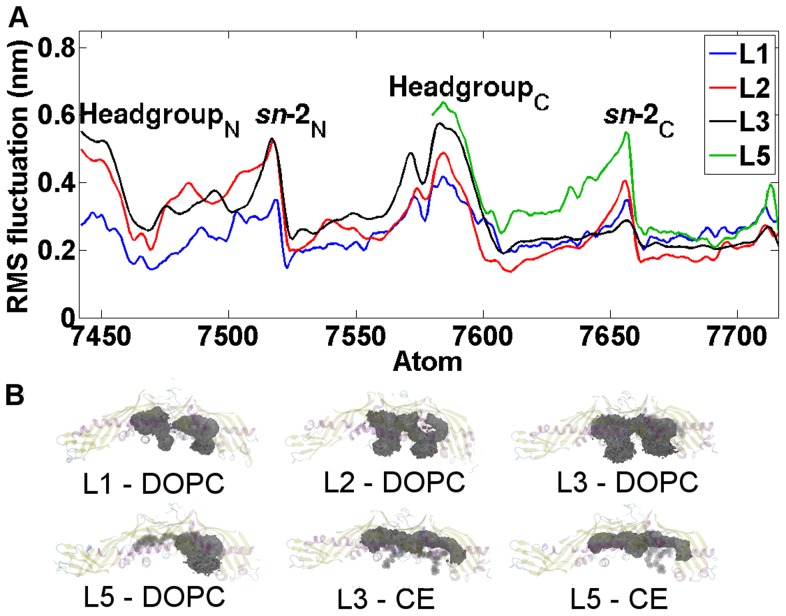
Figure 7. Dynamical properties of CETP bound lipids.
A) Atomic RMS fluctuation profiles for DOPCs (atoms 7441–7716) during the long 200  simulations. The peaks indicate the atoms that fluctuate the most over the course of simulations. The positions of DOPC headgroups and sn-2 chains with respect to atom numbers are labeled. The headgroup N and the sn-2N chain correspond with the headgroup and the sn-2 chain of the N-terminal DOPC, while the headgroup C and the sn-2C chain correspond with the C-terminal DOPC, see Figure 1A. B) Spatial density maps for DOPCs and CEs. The map reveals the movement of the corresponding lipid inside the binding pocket of CETP.

