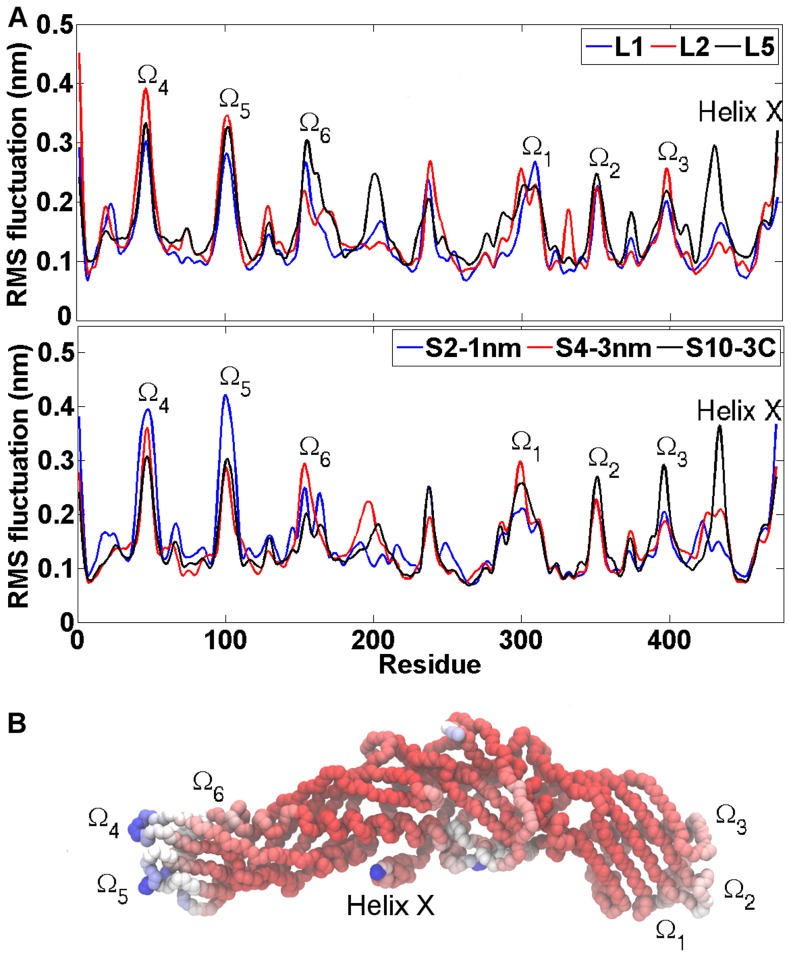
Figure 8. Dynamical properties of CETP.
A) Residual RMS fluctuations for short 20 ns and long 200 ns simulations. The peaks indicate the regions of CETP that fluctuate the most over the course of simulations. These regions are found in loops marked with omegas as well as in the residues corresponding to helix X. B) Residual B-factors mapped to the backbone structure of CETP. Red color indicates the most rigid regions in the structure, whereas white and blue indicate the most flexible structural regions in the order of growing flexibility. Loop regions are marked with omegas and the region corresponding to helix X is labeled.

