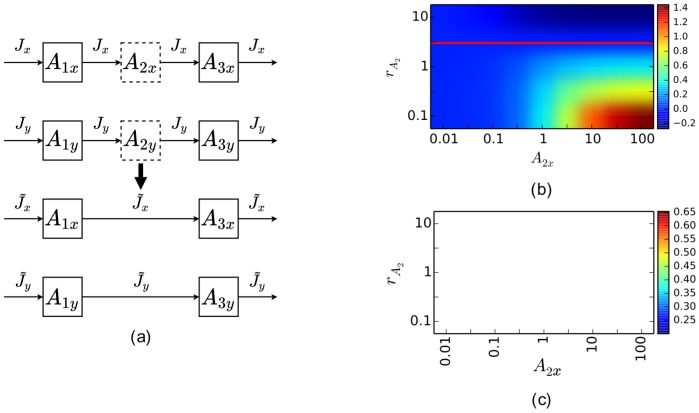
Figure 3. Metabolite removal in rKFP.
(a) A schematic diagram of getting the reduced model through metabolite removal in rKFP. The same figure scheme as in Figure 2a applies here. Parameter values used in generating the simulated data:  ,
,  , and
, and  . (b) Dependence of bias on the pool size of the missing metabolite in two conditions. (c) Dependence of error ratio on the pool size of the missing metabolite in two conditions.

