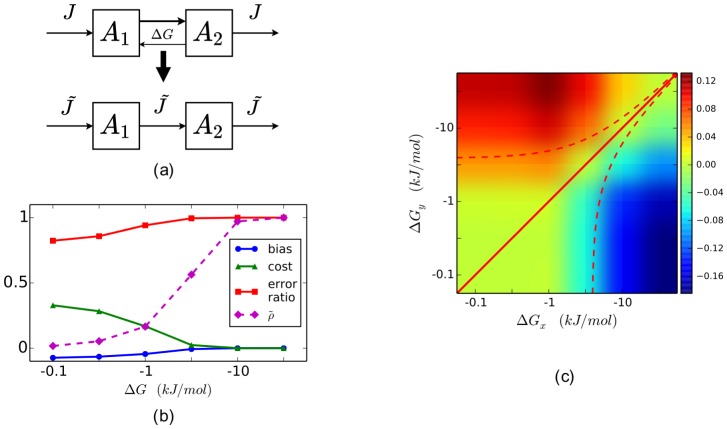
Figure 4. Modeling reversible reactions in KFP and rKFP.
(a) A schematic diagram of the toy system considered here; for rKFP two copies of each network are similarly made as in Figure 3a. Parameter values used in generating the simulated data:  ,
,  , and
, and  . (b) Dependence of the summary statistics on
  in KFP. (c) Dependence of the bias of
  on
on  of the two conditions in rKFP. The red solid diagonal line corresponds to
  where there is no bias. The red dashed curves correspond to a five-fold difference in the relative pool size changes between the substrate and product, a range we observe in our data.

