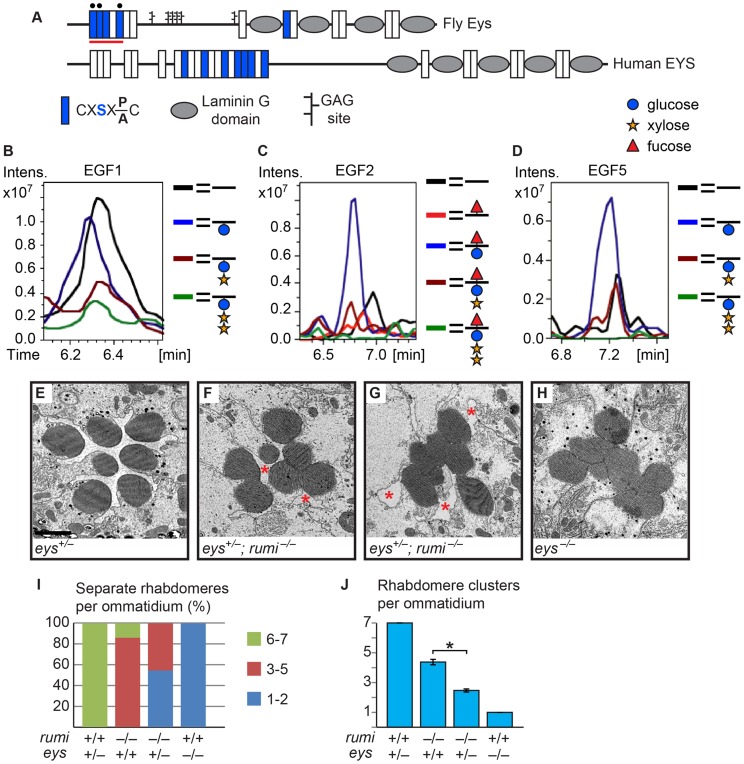
Figure 4. Eys is O-glucosylated and eys genetically interacts with rumi.
(A) Schematic of the fly and human Eys proteins. Red line indicates the EGF repeats used for mass spectrometry analysis. Black circles mark EGF repeats shown in B–D. (B–D) EIC data from mass spectral analysis of EGF1 (B), EGF2 (C), and EGF5 (D). Blue peak indicates the addition of O-glucose (blue circle) onto the EGF repeat. EGF2 is also modified by O-fucose (red triangle). Rumi appears to be less efficient in O-glucosylating EGF1 of Eys compared to the other EGF repeats when expressed in S2 cells. Full spectra and the peptide sequences are shown in Figure S4. (E) An eys heterozygous ommatidium with normal rhabdomere separation. Scale bar: 2 µm. (F,G) eys+/− rumi−/− ommatidia show a dramatic enhancement of the rumi−/− phenotype. In severe cases, all the rhabdomeres are attached (G). Pockets of IRS are marked by asterisks. (H) eys null ommatidia completely lack IRS. (I) Percentage of number of individual rhabdomeres per ommatidium for various genotypes. At least three animals were used for each genotype. (J) Quantification of average individual rhabdomere number per ommatidium for the data shown in I. All pairs are significantly different from each other (*P<0.0001).

