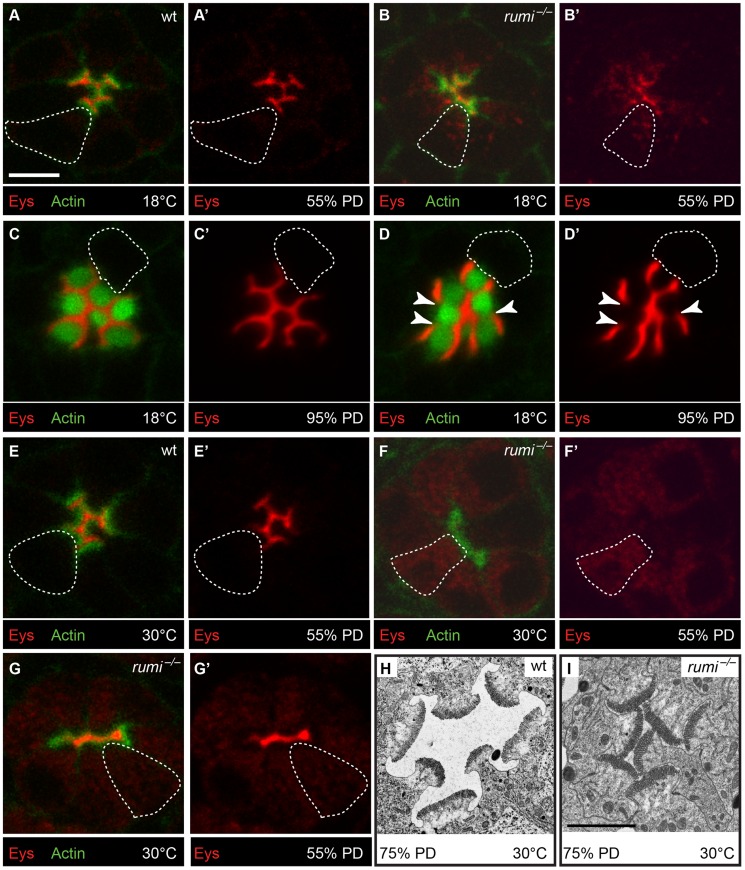
Figure 5. Loss of Rumi leads to intracellular accumulation and decreased IRS levels of Eys in a temperature dependent manner at the mid-pupal stage.
(A–G′) Confocal micrographs each showing a single ommatidium from the indicated genotypes. Phalloidin (green) marks Actin and is concentrated in rhabdomeres; Eys is shown in red. The dotted shapes mark the outline of a single photoreceptor cell body in each micrograph. The scale bar in A applies to A–G′ and is 5 µm. (A,A′) A wild-type ommatidium at 55% PD raised at 18°C. Note that Eys is primarily localized to the IRS. (B,B′) A rumi−/− ommatidium at 55% PD raised at 18°C. Note the decreased level of Eys in the IRS and its accumulation in the cell body. (C,C′) A wild-type ommatidium at 95% PD raised at 18°C. (D,D′) A rumi−/− ommatidium at 95% PD raised at 18°C. Note the increased amount of Eys in the IRS at this stage and disappearance of Eys from the photoreceptor cell bodies compared to B. White arrowheads mark points of rhabdomere attachment and gaps in Eys. (E,E′) A single ommatidium from a wild-type animal at 55% PD shifted to 30°C during IRS formation. (F–G′) Ommatidia from rumi−/− animals at 55% PD shifted to 30°C during IRS formation show severe Eys accumulation in the cell body, with either a complete lack of Eys in the IRS (F,F′) or a thin line of Eys in the IRS (G,G′). (H,I) Electron micrographs showing wild-type (H) and rumi−/− (I) ommatidia from 75% PD animals shifted to 30°C during IRS formation. The scale bar in I applies to H and I and is 2 µm.

