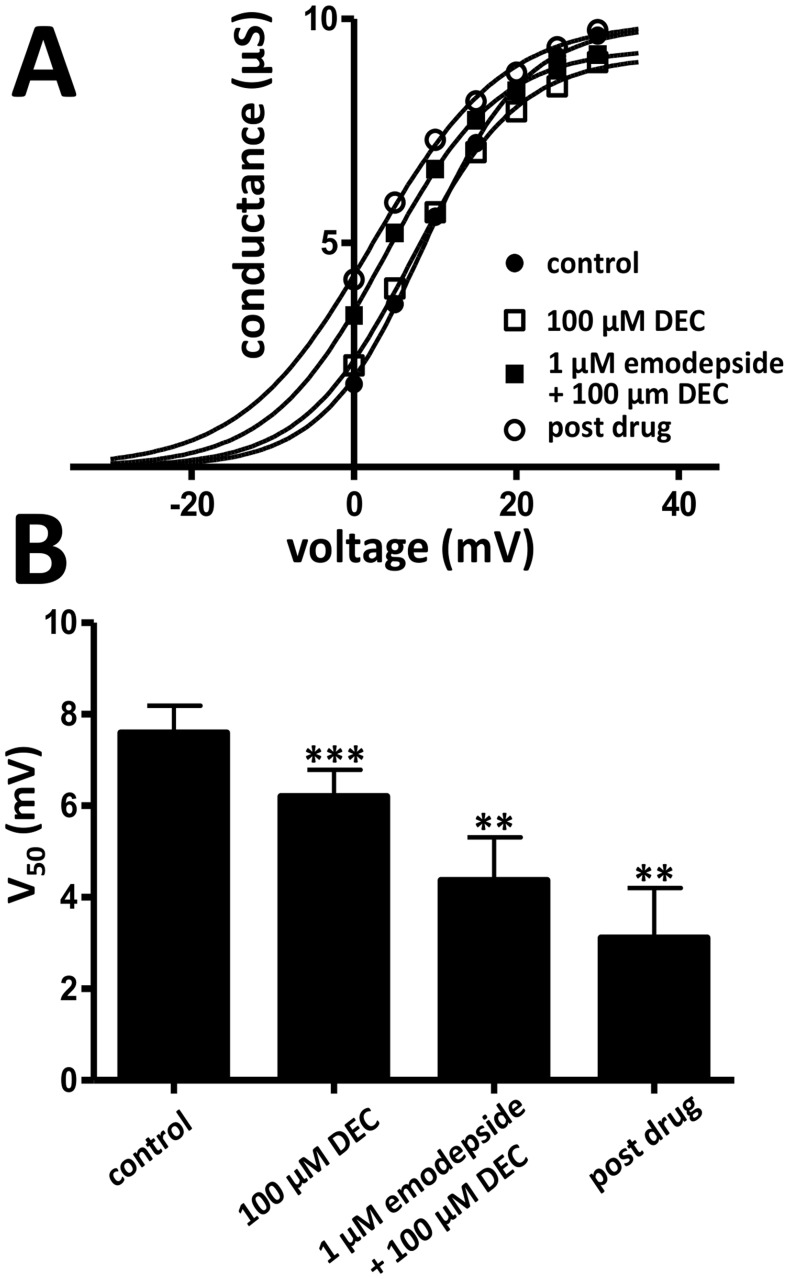
Figure 2. Effects of diethylcarbamazine and diethylcarbamazine combination on the activation curve of the SLO-1 K+ current.
A: Sample activation curve of the K+ currents. The conductance-voltage plot was fitted to the Boltzmann equation. Diethylcarbamazine shifted the V50 in the hyperpolarizing direction and the shift was sustained during 1 µM emodepside plus 100 µM diethylcarbamazine and the post-emodepside periods. Control (•) V50 = 8.5 mV; 100 µM diethylcarbamazine (□) V50 = 7.0 mV; 1 µM emodepside +100 µM diethylcarbamazine (○) V50 = 3.7 mV; post-emodepside (▪) V50 = 2.0 mV. B: Bar chart (mean ± s.e.) of the change in V50 of the K+ currents produced by diethylcarbamazine and emodepside plus diethylcarbamazine (**p<0.01, ***p<0.001, n = 4–5, paired t-test).

