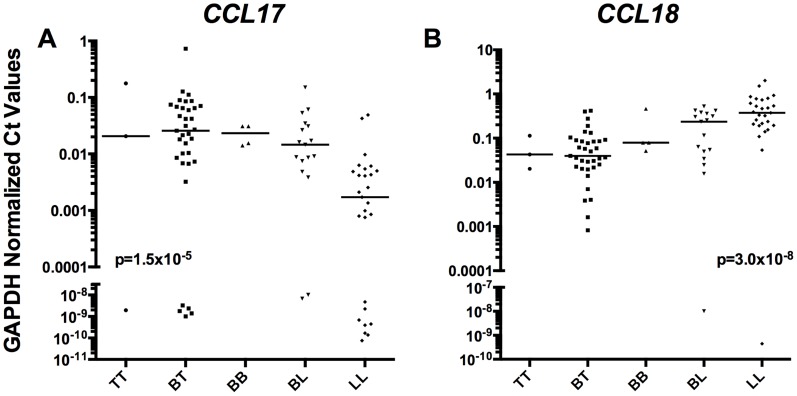
Figure 1. CCL17 and CCL18 by Ridley Jopling classification.
Relative tissue mRNA levels of CCL17 (A) and CCL18 (B) normalized to GAPDH were arranged in order of specific leprosy classification and analyzed for significance by non-parametric trend test with variables TT, BT, BB, BL, and LL treated as increasing categorical variables, p values displayed. Lines are medians. A value of 40 was given to undetectable Ct Values in order to graphically represent on log scale.

