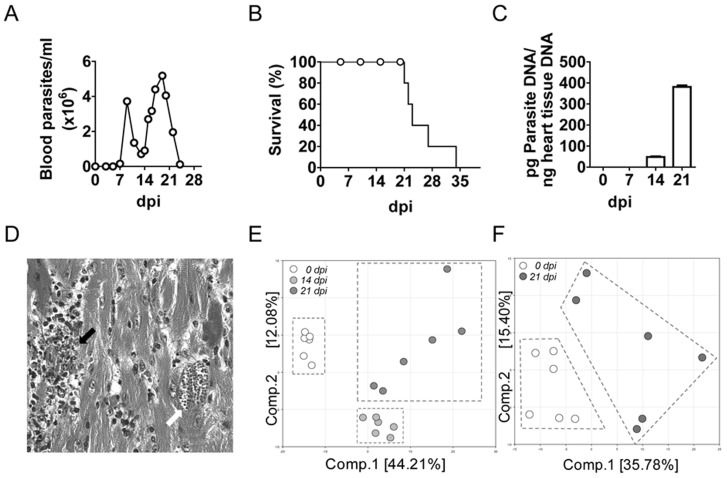
Figure 1. Parasite burden and mice survival during T. cruzi infection.
Parasite burden in blood and survival were monitored every two-three days as described in material and methods section. (A) Parasitemia. (B) Parasite DNA quantification by qPCR as described in the methods. (C) Mice survival. (D) Representative heart tissue section stained with H&E showing amastigote nests (white arrow) and mononuclear cell infiltration (black arrow). (E) Principal component analysis in heart tissue samples. (F) Principal component analysis in plasma samples.

