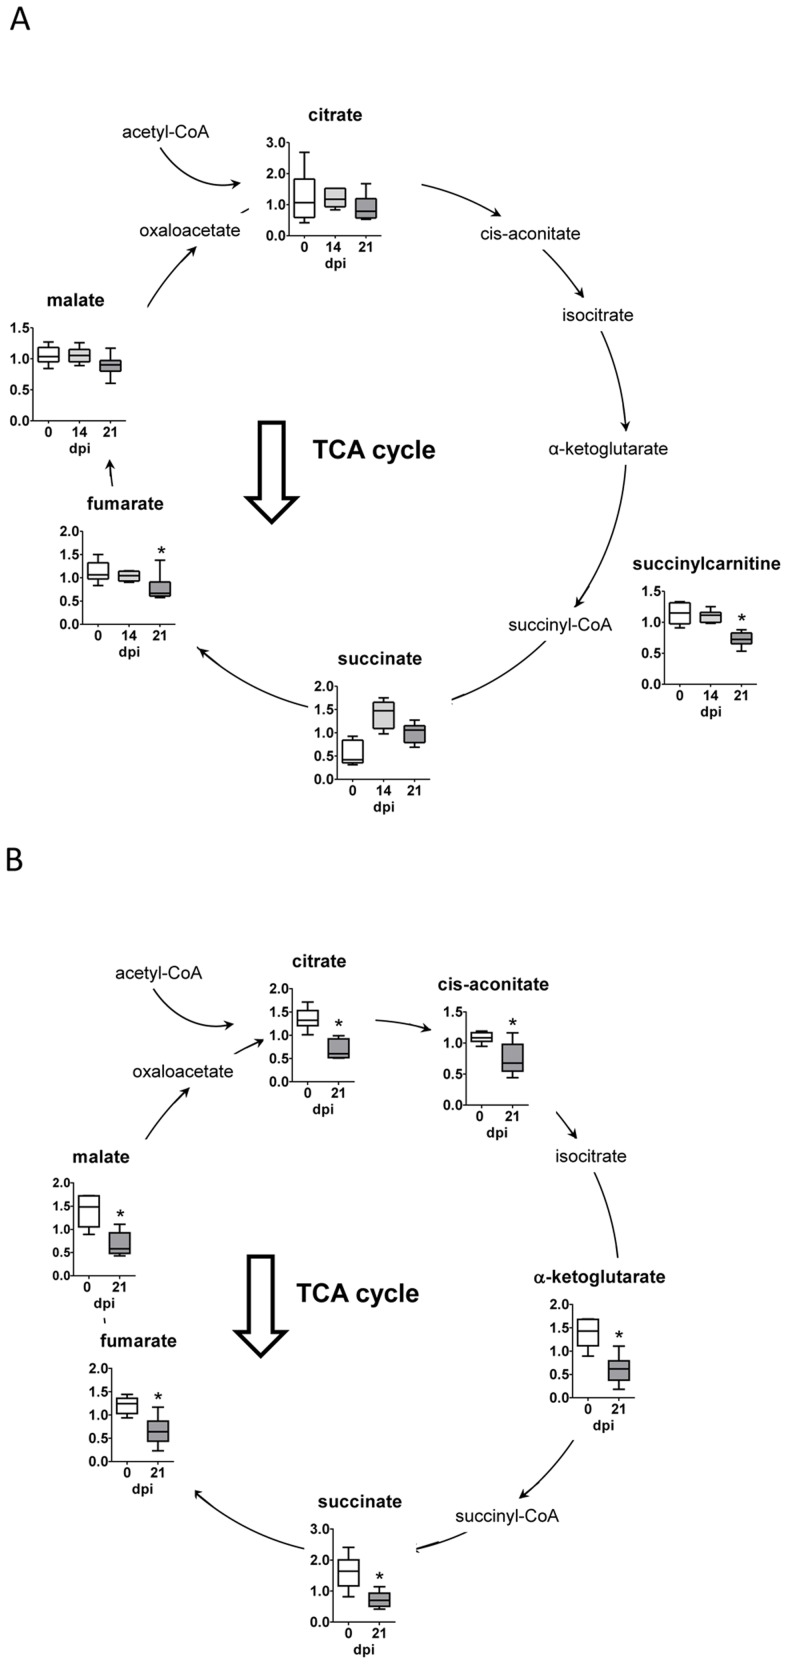
Figure 3. Tricarboxyilic acid cycle.
(A) Graphs represent the ScaledImpData of different biochemicals of the tricarboxyilic acid cycle from heart tissue samples. (B) Same as in A from plasma samples. Samples from control uninfected mice are in white boxes, from mice sacrificed at 14 dpi in light gray boxes and from mice sacrificed at 21 dpi in dark grey boxes. Statistically significant differences respect to uninfected mouse samples are denoted, *p≤0.05.

