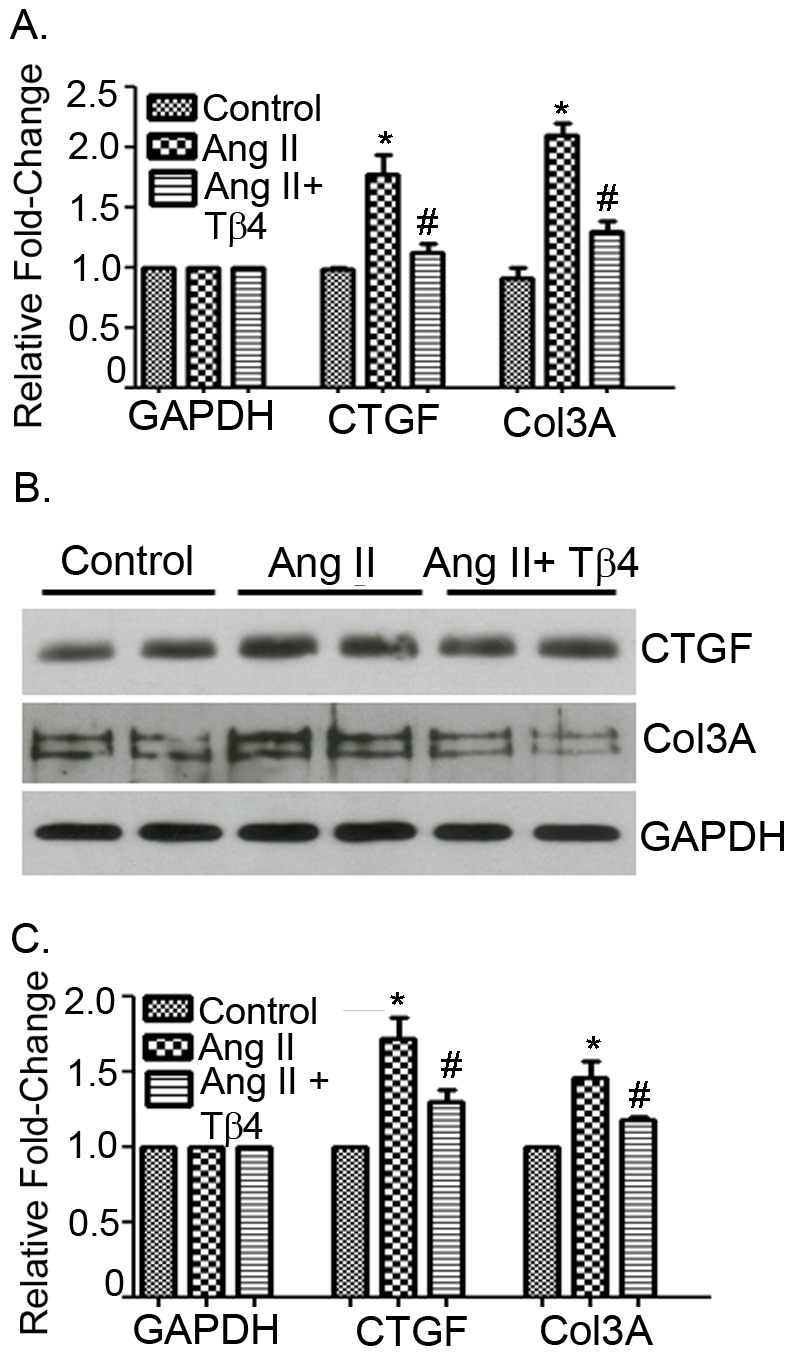
Figure 8. Tβ4 treatment attenuates CTGF and Col 3a in the lung fibroblast.

Lung fibroblasts were stimulated with Ang II in the presence or absence of Tβ4. (A) The mRNA expression of CTGF and Col 3a were determined by qRT-PCR using their specific probes. (B) The protein level of CTGF and Col 3a were determined by Western blot using CTGF and Col 3a specific antibodies. (C) The quantification of Western blot is shown graphically. The data presented are mean ± SE. *p<0.05 vs. control, # p<0.05 vs. Ang II treatment (n = 3).
