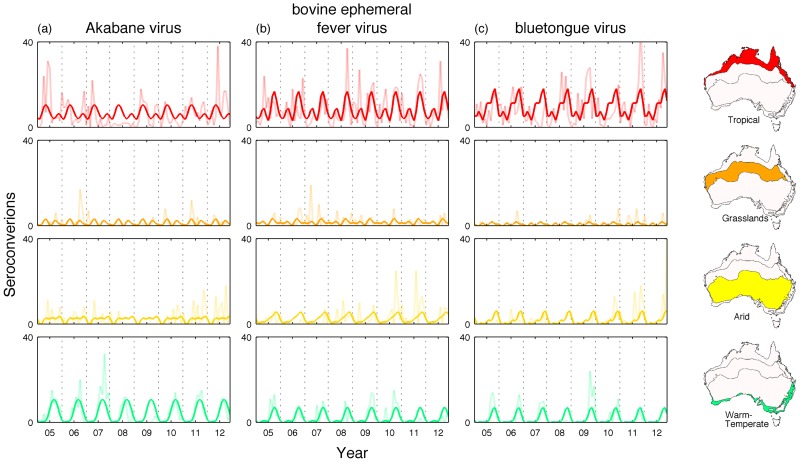
Figure 2. Time series of the number of positive seroconversions per month between July 2004 - June 2012 in four distinct climate regions: tropical, grasslands, arid and warm-temperate for Akabane virus (a), bovine ephemeral fever virus (b), and bluetongue virus (c).
The periodic annual function, obtained by summing the 12-monthly, 6-monthly and 3-montly harmonics (bold line) and the raw data (faded line) is shown. Vertical grid lines represent 1st July for each year, coinciding with the start of the vector season in the southern hemisphere.

