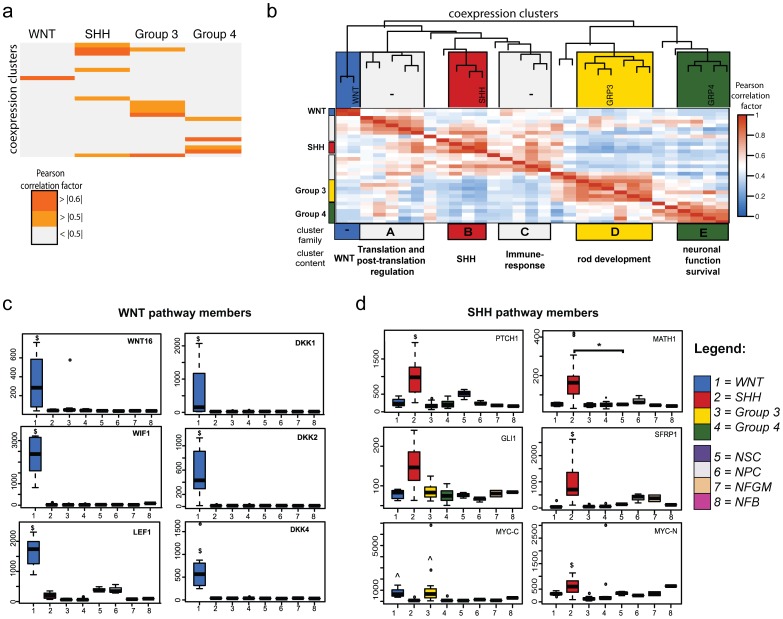
Figure 2. Gene co-expression and module association with medulloblastoma molecular subgroups.
a. The gene co-expression network was constructed for the combined medulloblastoma cohorts. Gene expression from each co-expression cluster was correlated to medulloblastoma subgroup. Correlation strength (Pearson correlation coefficient) across co-expression clusters and medulloblastoma subgroups was graphed using a grey to orange color scale. b. Using the association between clusters as a distance measure, cluster family topology was generated and the co-expression network was graphed as a dendrogram describing gene cluster relatedness. The main enriched pathways in cluster families are shown below and indicate medulloblastoma subgroup-associated functional gene neighborhoods. Expression of major contributors to cluster association for c. WNT and d. SHH medulloblastoma are shown in Box-Whisker plots for each sample group included in this study. * −p<0.05, $ −p<0.05 compared to all control groups with n>1 and exclusive for molecular subgroup, ∧ −p<0.05 compared to all control groups but not exclusive for medulloblastoma subgroup, NFB - normal fetal brain, NFGM - normal fetal germinal matrix, NPC - neural progenitor cells, NSC - neural stem cells.

