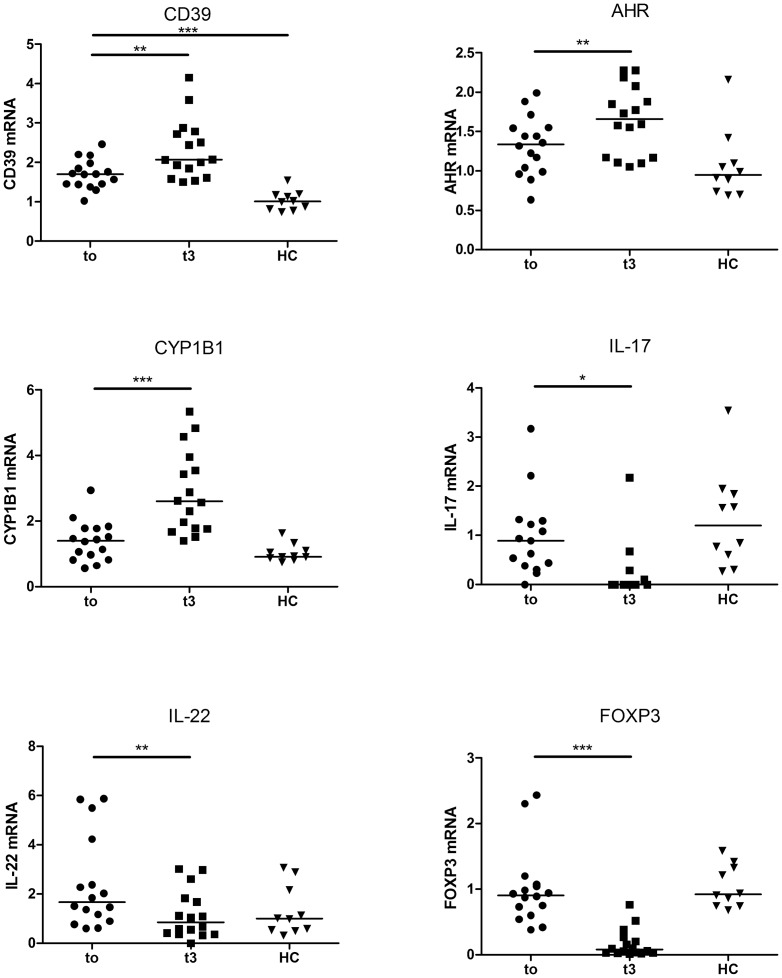
Figure 1. Ex vivo mRNA expression in total PBMCs from fingolimod-treated patients.
Scatter dot plots show relative mRNA expression levels in PBMCs from MS patients before (t0) or after 3 months (t3) of treatment by fingolimod, and healthy controls (HC) analysed by q-PCR. For each target, individual mRNA levels were expressed as relative values to the mean level of the control group. The mRNA expression levels of CD39 (p = 0.0033), as well as of AHR (p = 0.007) and CYP1B1, an AHR-induced gene (p<0.0001) were increased after fingolimod treatment. On the contrary, fingolimod reduced the mRNA levels of IL-17, IL-22 and FOXP3. Horizontal lines represent the median value in all subgroups. *, ** and *** indicate p-values of ≤0.05, ≤0.01 and ≤0.001 respectively.

