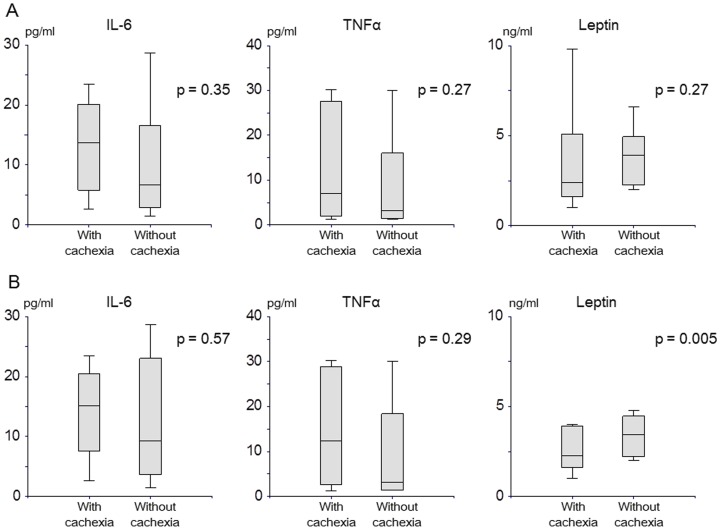
Figure 5. Serological markers between patients with cachexia and those without cachexia.
A. In all patients. IL-6: 13.8 (range, 2.6 to 23.4) in patients with cachexia vs. 6.8 (1.4 to 28.7) pg/ml in those without cachexia, p = 0.35; TNF-α: 7.1 (1.2 to 30.2) vs. 3.3 (1.2 to 30.0) pg/ml, p = 0.27; leptin: 2.4 (1.0 to 9.8) vs. 4.0 (2.0 to 9.9) ng/ml, p = 0.27, respectively. B. In male patients. IL-6: 15.2 (range, 2.6 to 23.4) in patients with cachexia vs. 9.4 (1.4 to 28.7) pg/ml in those without cachexia, p = 0.57; TNF-α: 12.4 (1.2 to 29.0) vs. 3.2 (1.4 to 28.6) pg/ml, p = 0.29; leptin: 2.3 (1.0 to 8.8) vs. 3.45 (2.0 to 2.8) ng/ml, p = 0.34, respectively.

