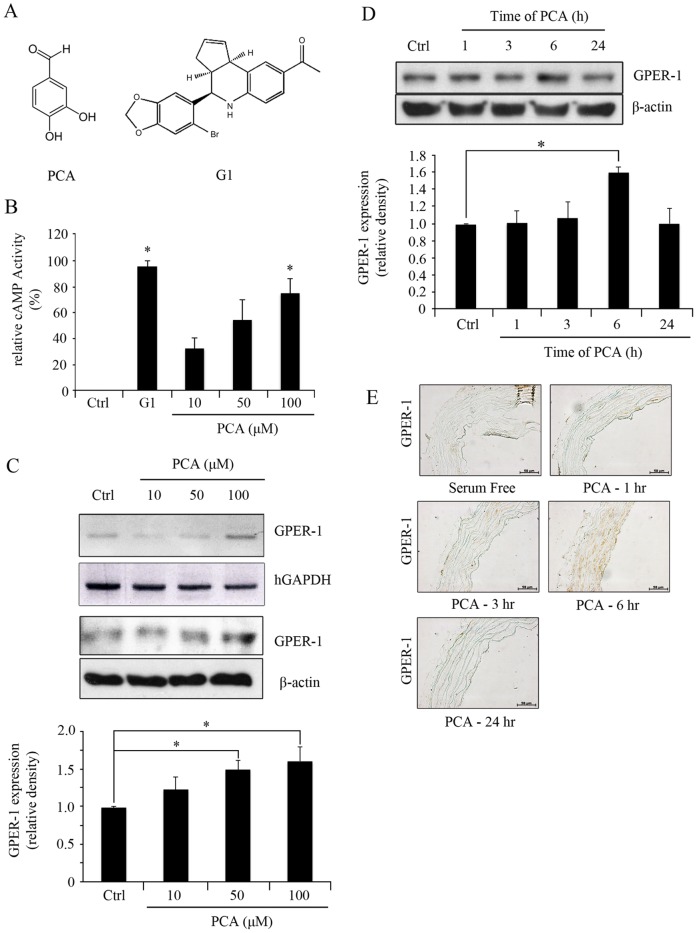
Figure 1. PCA induces expression of GPER-1.
(A) The chemical structure of PCA and G1. (B) HUVECs were treated with G1 (3.0 µM) and PCA (10, 50, or 100 µM) for 1 hr to measure the levels of cAMP activity. (C) HUVECs were treated with PCA (100 µM) over 1, 3, 6, 24 hrs. (D) HUVECs were treated with PCA (10, 50, or 100 µM) for 6 hrs. Blots are representative of 3 independent experiments. Densitometric analyses are presented as the relative ratio of GPER-1 to β-actin. Data are presented as mean±SEM; * P<0.05. (E) Aortic segments were harvested from Sprague Dawley rats and cultured ex vivo in serum-free media with PCA (100 µM) over 1, 3, 6, 24 hrs. Segments were than fixed for immunohistochemistry of GPER-1 using 4% paraformaldehyde.

