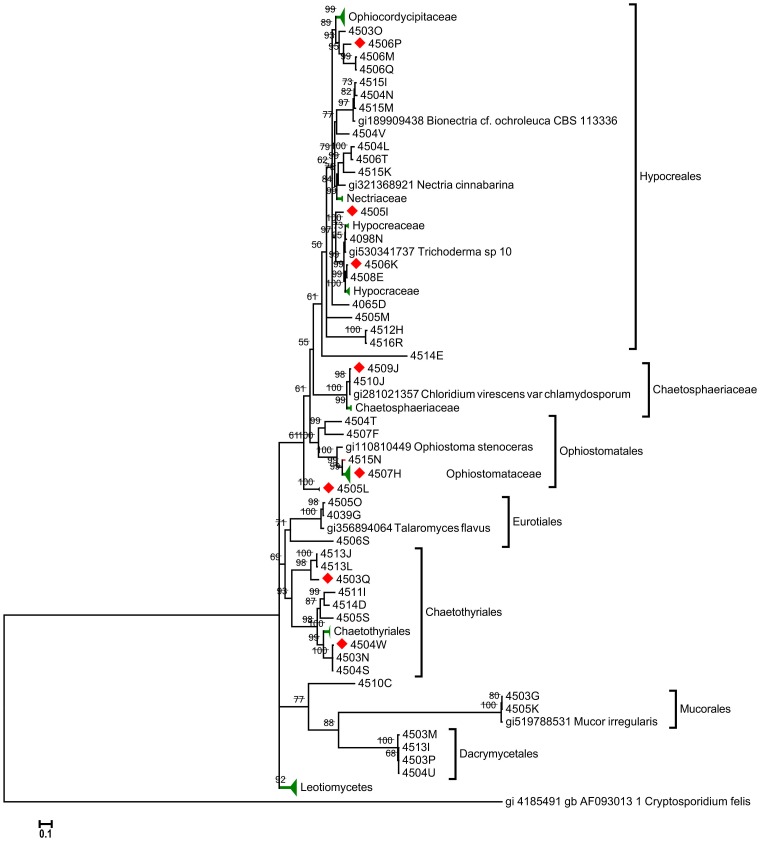
Figure 3. Bayesian phylogenetic tree of the ITS region sequences of fungi isolated from the gut of Costa Rican beetles.
Numbers above branches represent their Bayesian-calculated posterior probabilities (two million generations, chain temperature = 0.2, standard deviation <0.02). Numbers between brackets represent the number of isolates that shared the same sequence. Compress branches are colored in green. Red diamonds indicates positive cellulolytic activity.

