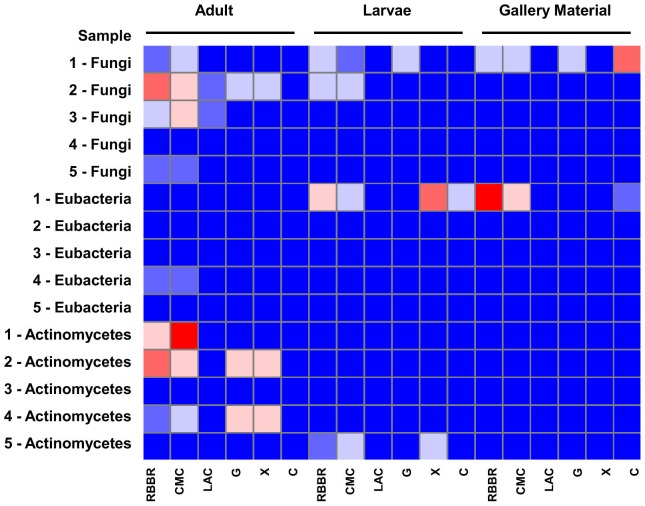
Figure 4. Pattern of enzymatic degradation of plant cell wall components for the fungal and bacterial isolates obtained from Passalid beetles.
Heat map of the enzymatic activity of fungi, eubacteria and actinomycetes by sample type (blue represents the lower activity whereas red represents higher activity on the assay). Numbers correspond to sample number. RBBR: Lignin peroxidase activity in MEA-RBBR. CMC: Cellulase activity in CMC agar. LAC: Laccase activity on ABTS test. G: Glucanase activity. X: Xylanase activity. C: Cellobiase activity.

