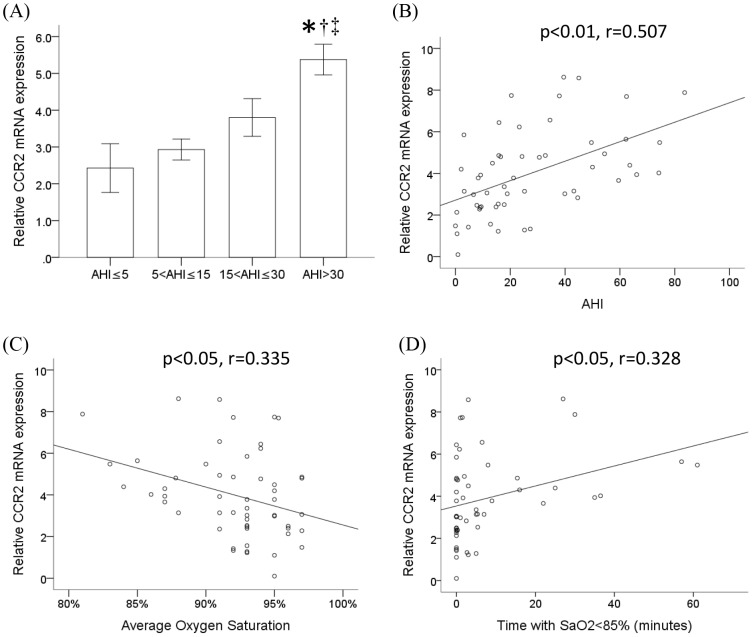
Figure 1. CCR2 mRNA expression significantly increased in monocytes of severe OSA patients.
(A) The monocytic CCR2 mRNA expression of 54 patients from four different groups was analyzed by RT/real-time PCR. Data were means and standard errors. (mean ± SE, *: P<0.05 vs. AHI ≤5, †: P<0.05 vs 5< AHI ≤15, ‡: P<0.05 vs 15< AHI ≤30) (B) Linear regression demonstrated the positive correlation between AHI and CCR2 mRNA expression levels in monocytes (p<0.01, r = 0.507). (C) Linear regression demonstrated the negative correlation between average oxygen saturation in patients and CCR2 mRNA expression levels in monocytes (p<0.05, r = 0.335). (D) Linear regression demonstrated the positive correlation between the monocytic CCR2 mRNA expression level and the time with SaO2 <85% in OSA patients (p<0.05, r = 0.328).

