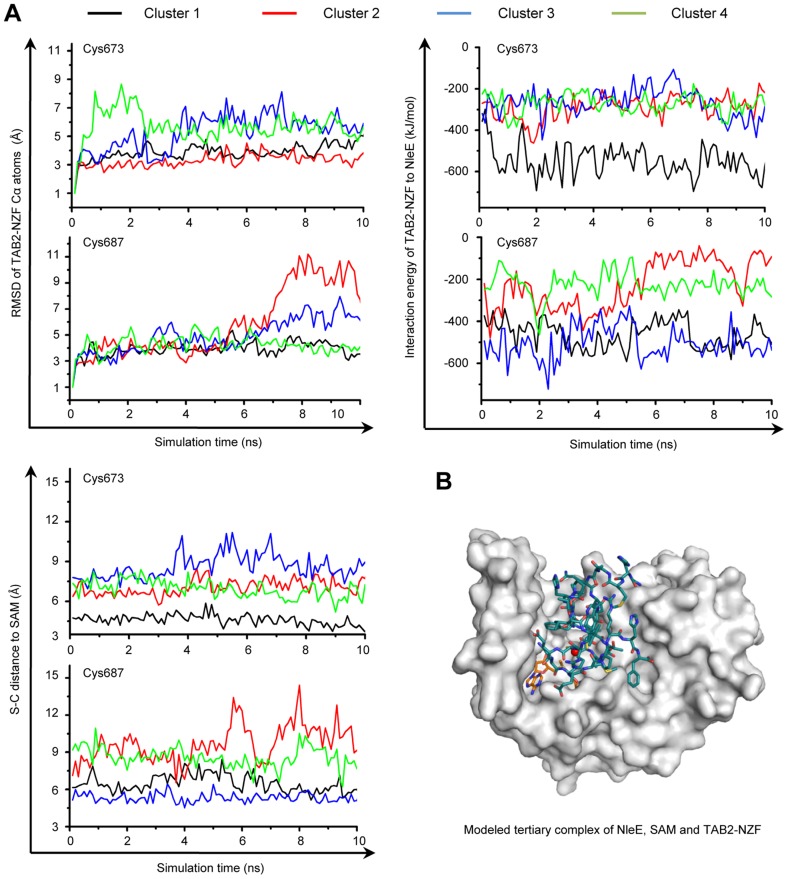
Figure 5. MD simulation shows Cys673 in TAB2-NZF being structurally favorable for methyltransfer from NleE.
(A) The dynamic motion (indicated by the RMSD values) (upper left), the change of interaction energy (upper right) and the S-C distance (lower left) of the largest four clusters in Cys673 or Cys687-restrainted 15-ns MD simulation (shown are snap shots of the last 10-ns simulation). Representative poses of the four clusters (black, red, blue and green curve) obtained from protein docking performed with restrained distance from Cys673/Cys687 to the methyl carbon in SAM (S-C distance) were used as starting templates for the 15-ns MD simulation shown. (B) Overall view of the docked NleE-SAM-NZF complex. NleE is shown as white surface model; the SAM is in orange sticks; TAB2-NZF is in blue sticks with the Zn represented by a red dot.

