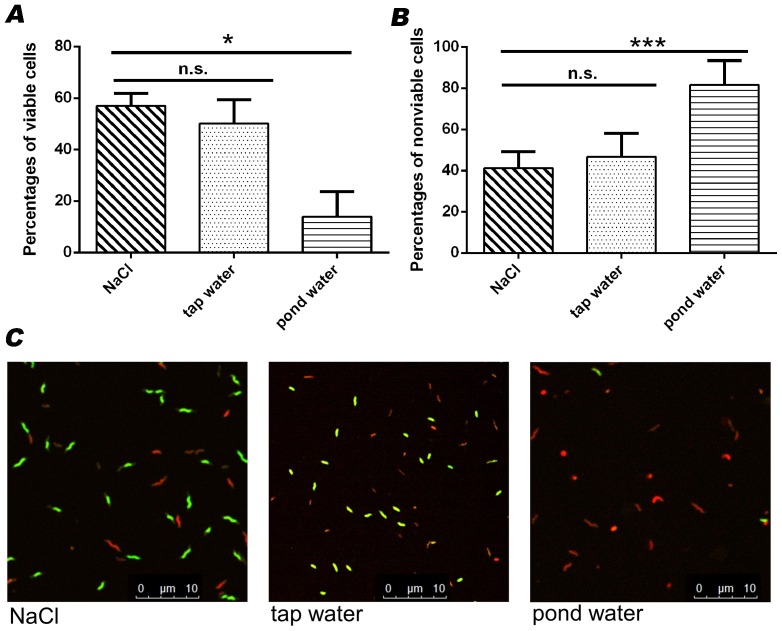
Figure 3. Percentages of (A) viable and (B) nonviable C. jejuni DSM 4688T determined by fluorescence microscopy after inoculation of cells in NaCl, tap water and pond water.
Percentages of intermediate cells were not included in the bar diagrams. Results are shown as average from three independent experiments. Significant differences compared to untreated cells are indicated by asterisks (ANOVA, * p<0.05, *** p<0.001, n.s. not significant). (C) Fluorescence images of cells after inoculation in NaCl, pond water or tap water. Green: viable bacteria; red: nonviable bacteria; orange: intermediate bacteria.

