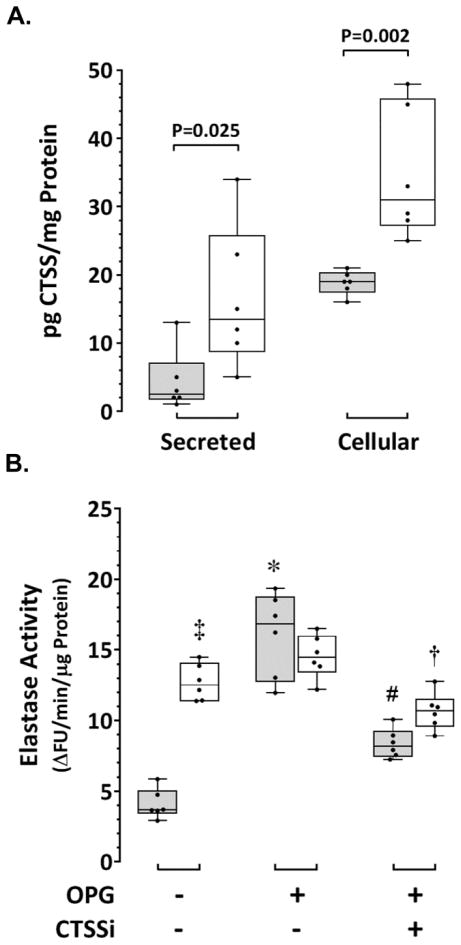
Figure 3. Elevated CTSS and CTSS-derived elastase activity in human AASMC and stimulation of CTSS-derived elastase activity in human AoSMC by rhOPG.
A. Concentration of CTSS measured in the supernatant (secreted) and cell lysate (cellular) of healthy human aortic smooth muscle cells (AoSMC; grey) and aortic smooth muscle cells derived from human AAA biopsies (AASMC; white) after 96 hours in culture. Data expressed as median and interquartile range with maximum and minimum data points (whiskers) for pg CTSS per mg protein from six repeat cultures (P values calculated by Mann-Whitney U test). B. CTSS-derived elastase activity measured in AASMC (white) and AoSMC (grey) cultured over 36 hours in control media, in the presence of rhOPG (50 nM), or in the presence of rhOPG + CTSS inhibitor (CTSSi; 20 nM). Data expressed as median and interquartile range with maximum and minimum data points (whiskers) for change in fluorescence units (ΔFU) per minute per μg protein from six repeat cultures (P values calculated by Mann-Whitney U test); ‡P=0.002 vs AoSMC control; *P=0.002 vs AoSMC control; †P=0.004 vs AASMC in OPG alone; #P=0.002 vs AoSMC in OPG alone.

