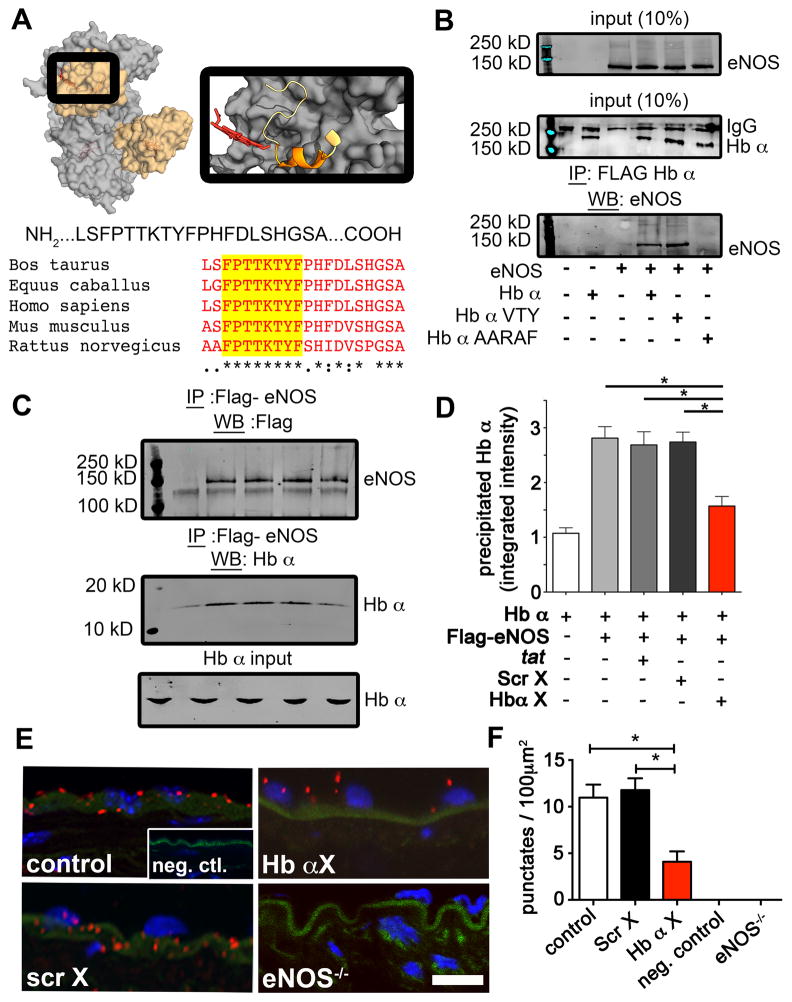
Figure 1. Identification of a conserved sequence of Hb α that interacts with eNOS.
a, In silico modeling of the PDB crystal structures for eNOS (gray; 3NOS) and Hb α (orange; 1Y01) using GRAMMX server. The magnified image on right shows the region of Hb α (ribbon structure) that is modeled to interact with eNOS (dark gray region). The identified Hb α sequence is depicted below and was blasted against other mammalian species showing conserved sequences highlighted in yellow. b, Western blot analysis of co-immunoprecipitations experiments from HEK 293 cells overexpressed with eNOS, Flag-Hb α or Flag-Hb α mutants. c, Western blot analysis of Flag-eNOS input, Hb α input and Hb α precipitated with Flag-eNOS (n=3 separate runs). d, Quantification of precipitated Hb α with p<0.05; all error bars represent s.e.m.. e, Proximity ligation assay for eNOS and Hb α (red punctuates) on transverse sections of a mouse thoracodorsal artery. Green shows internal elastic lamina autofluorescence, blue is DAPI indicating nuclei. Scale bar is 10 μm. f, The graph on right shows quantification of red punctates from the proximity ligation assay with p<0.05; all error bars represent s.e.m. (n=3 mice).

