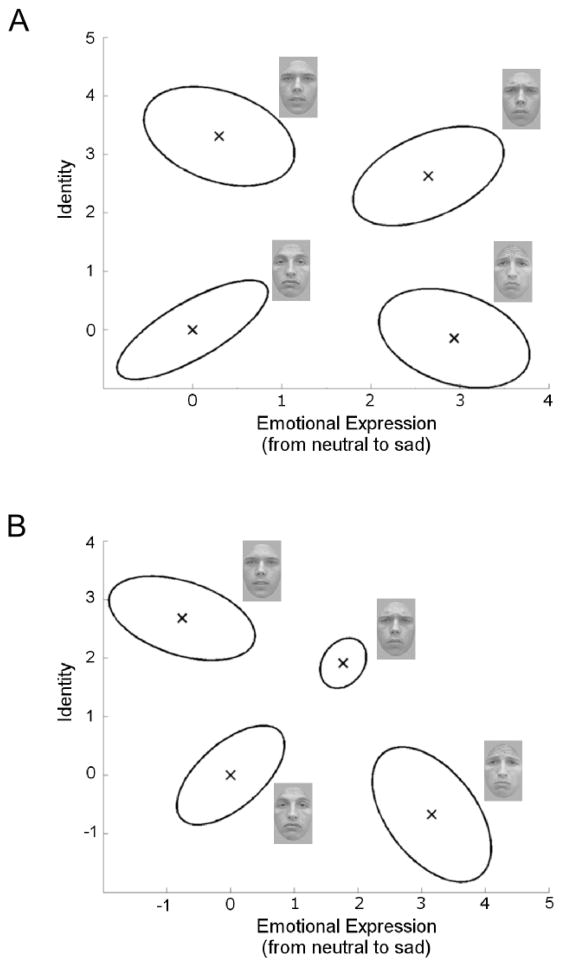
Figure 11.
Best-fitting configuration of perceptual distributions for the restricted GRT-wIND models fitted to the experimental data. Panel A shows the restricted model in which all variances are equal to one. Panel B shows the restricted model that assumes decisional separability for both dimensions. Ellipses are contours of equal likelihood. Face images associated with each perceptual distribution are shown.

