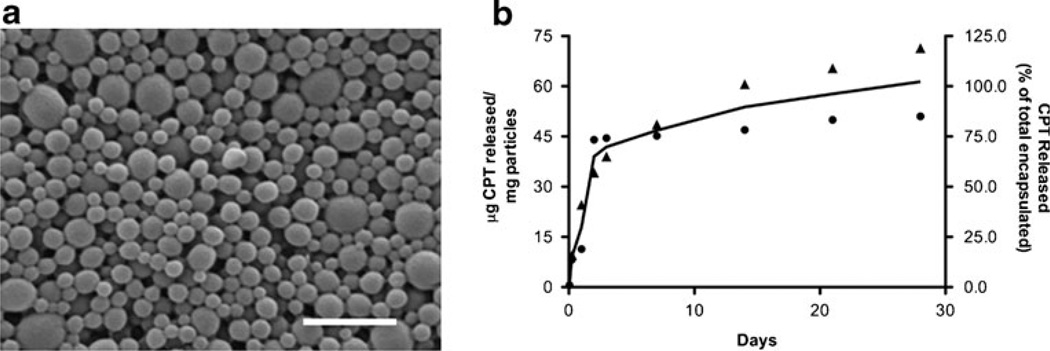
Fig. 3.
Characterization of CPT-loaded nanoparticles. a A representative scanning electron micrograph of nanoparticles (scale bar=1 µm). The mean diameter of particles is 158±62 nm. b Release of CPT from nanoparticles in phosphate-buffered saline at 37°C over 28 days. Total loading of CPT is 62±14 µg/mg. A biphasic profile is observed with an initial burst release during the first 3 days followed by sustained release. Left axis represents micrograms CPT released from 1 mg of particles. Right axis represents percentage of CPT released from the total loaded within particles. Square and triangle data points represent replicate sets of data. The curve represents the average CPT release profile

