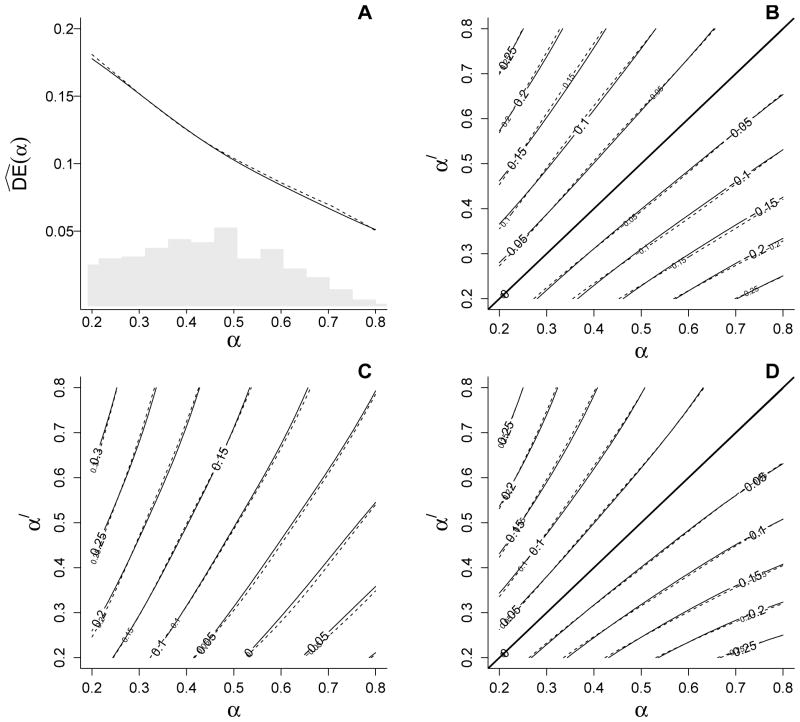
Figure 1.
IPW estimates of (A) direct , (B) indirect , (C) total , and (D) overall effects from the simulation study. Solid lines represent the true effects, and dashed lines represent average effect estimates obtained using the IPW estimators. The histogram in (A) represents the distribution of vaccine coverage observed from the simulated data. Note that plots for and are symmetric in absolute value because Ŷ(0; α) − Ŷ(0; α′) = −{Ŷ(0; α′) − Ŷ(0; α)} and Ŷ(α) − Ŷ(α′) = −{Ŷ(α′) − Ŷ(α)}.

