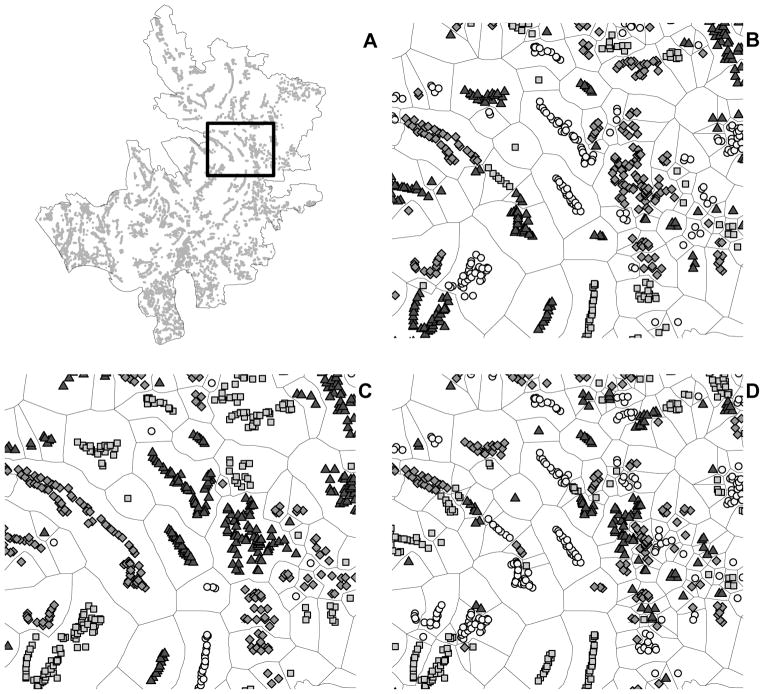
Figure 2.
Definition of neighborhoods from geo-referenced data. Household clusters, i.e., baris, which are represented as gray dots in (A), were partitioned into distinct neighborhoods, i.e., groups, according to a single-linkage agglomerative clustering procedure. The rectangle in (A) is magnified in (B), (C), and (D). The total number of groups was set to (B) 700 neighborhoods for the main analysis, and (C) 400 and (D) 1100 neighborhoods for the sensitivity analysis.

