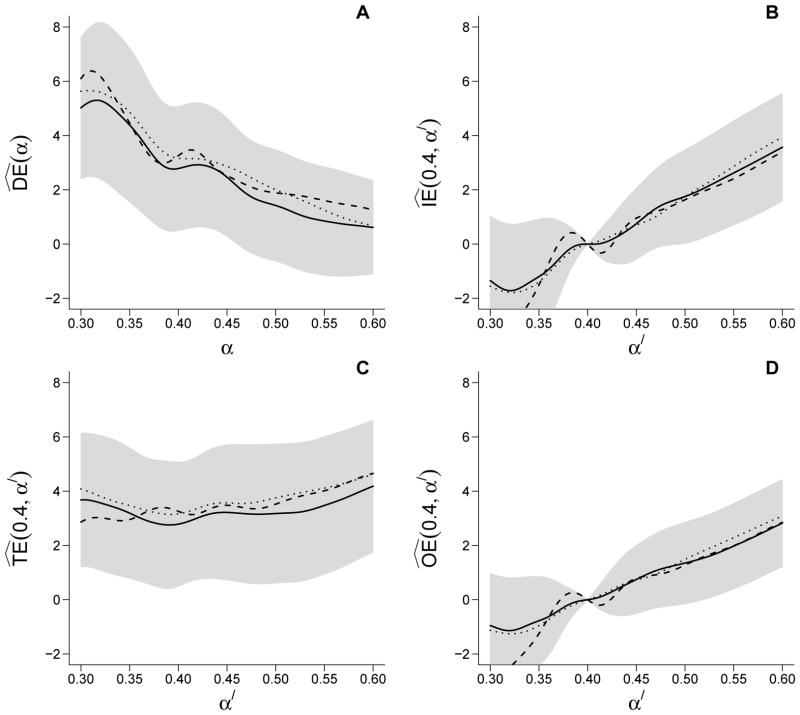
Figure 4.
IPW estimates of (A) direct , (B) indirect , (C) total , and (D) overall effects based on the cholera vaccine trial data. The solid line gives the estimates using the 700 neighborhood partition. The dashed and dotted lines correspond to estimates using the 400 and 1100 neighborhood partitions. The gray regions around the effect estimates represent approximate pointwise 95% confidence intervals using the 700 group partition.

