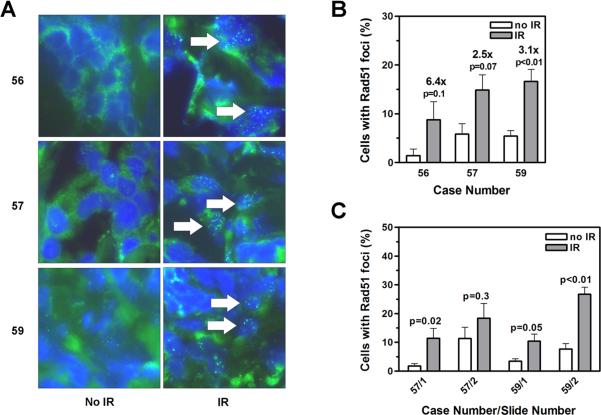
FIGURE 2.
A. Representative images illustrating the induction of RAD51 foci in three tumors (cases 56, 57, 59) following exposure of samples to ionizing radiation (IR) ex-vivo. B. Quantification of cells with RAD51 foci. Bars represent means with upper standard error. Relative fold induction with IR is given. P-value, unpaired t-test, two sided. C. RAD51 foci analysis analogous to panel B. Numbers indicate slide numbers per case.

