Figure 2.

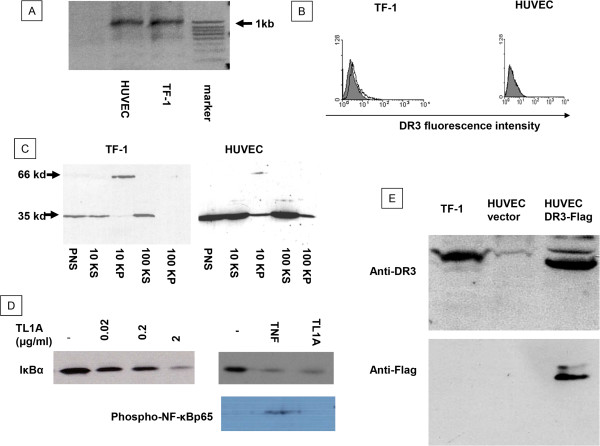
Expression of DR3 in TF-1 and HUVEC. (A) RT-PCR showed HUVEC expressed full-length DR3 mRNA, which was the same as that of TF-1 cells. (B) Flow cytometry using a monoclonal antibody to DR3 showed positive cell surface staining on TF-1 cells and a very low level of expression on HUVEC. (C) Immunoblotting with antibody to DR3 C-terminus showed both cell types express a full-length 59kDa DR3 in the 10KP fraction, containing mainly cell membrane protein. A DR3 band in TF-1 cells was stronger than that of HUVEC with equal protein loading. Both cells also showed a 35kDa band in the soluble subcellular fraction. (D) TL1A induced concentration dependent IκBα degradation in TF-1 cells. While TNF (5 ng/ml) and TL1A (0.2 ug/ml) both induced IκBα degradation, phosphor-NFκBp65 was only detected after TNF treatement in the nuclear fraction of TF-1 cells. (E) Immunoblot for DR3 in 10K pellet fraction of HUVEC after transfection. Lane 1, TF1 10K pellet as positive control; Lane 2, HUVEC transfected with empty vector; Lane 3, HUVEC transfected with DR3-flag. Two gels with same sample loading were immunoblotted with anti-DR3 antibody (upper blot) and anti-Flag (lower blot). PNS: post nuclear supernatant. 10KS: 10k supernatant. 10KP: 10k pellet. 100KS: 100k supernatant. 100KP: 100k pellet. 50 μg proteins from each fraction was analyzed by immunoblotting, blots were representatives of at least 3 separate experiments.
