
Figure 3.
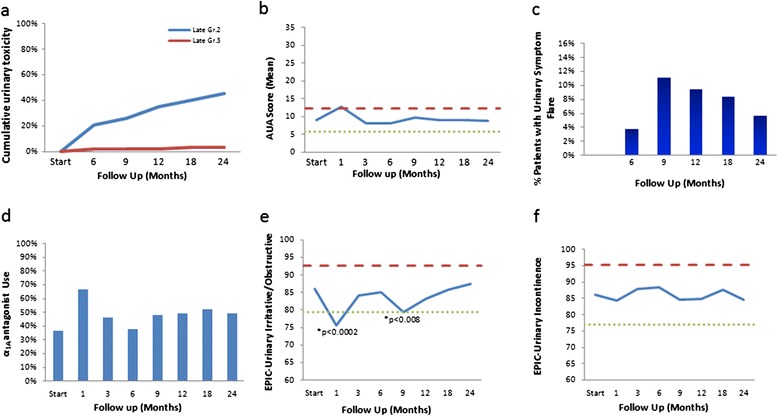
Urinary Toxicity and Quality of Life. a) Cumulative late urinary toxicity (grade 2 in blue and grade 3 in red). b) Average AUA score. AUA scores range from 0–35 with higher values representing worsening urinary symptoms. c) Percent of patients with urinary symptom flare, which was defined as having both an AUA score ≥15 with an incrase of ≥5 points above baseline. d) Percent of patients using α-antagonists at baseline and at different time points at follow up. e-f) Average EPIC urinary irritative/obstructive (e) and incontinence (f) scores. The thresholds for clinically significant changes in scores (1/2 standard deviation above and below the baseline) are indicated by the red and green lines. EPIC score range from 0–100 with higher values representing a more favorable health-related quality of life.