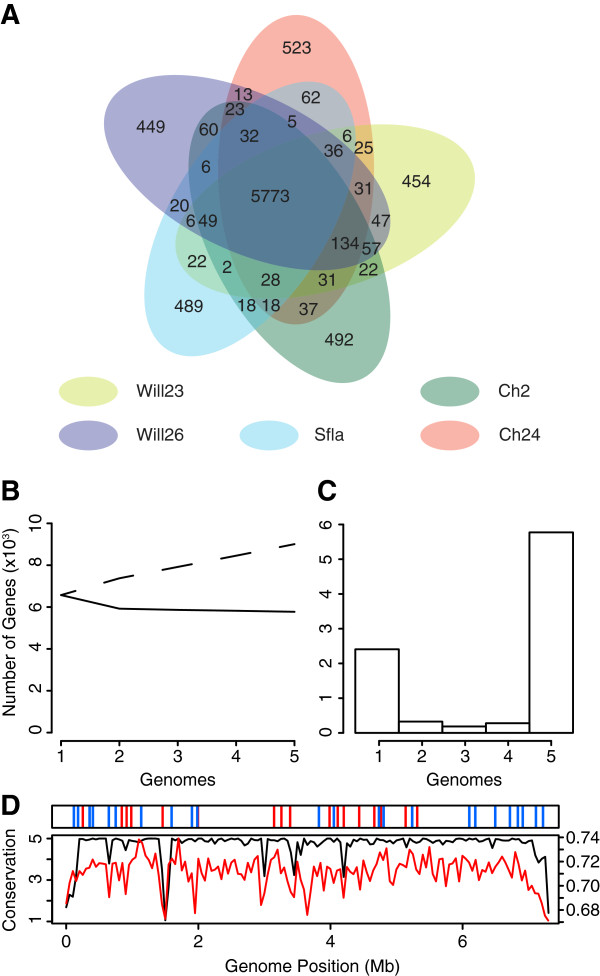
Figure 1.

Gene conservation in S.pratensis. (A) Co-occurrence of positional orthologs across the five S. pratensis genomes. Note the low number of genes shared among two to four genomes. Most genes are either unique or conserved. (B) The size of the core (solid line) and pan (dashed line) genome in relation to numbers of genomes compared. (C) The number of unique positional orthologs that are shared by a given number of genomes. (D) The upper panel shows the locations of secondary metabolite gene clusters (blue bars) and the bldB/hpb genes (red bars). The lower panel shows the chromosome position of core and variable genes as the average number genomes sharing genes in a 50kb window (black line). Average genome G + C content (red line) is calculated for the same 50 kb windows.
