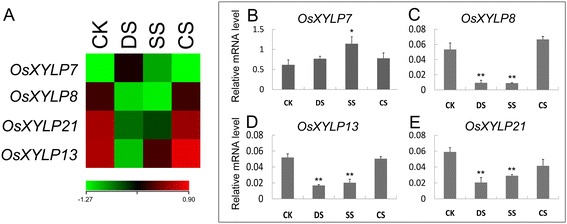
Figure 6.

Differential expression profiles of OsXYLP genes under abiotic stresses. The microarray data (GSE6901) of gene expression under various abiotic stresses (CK, control; DS, drought stress; SS, salt stress; CS, cold stress) were used for cluster display. The average log signal values of OsXYLP genes are presented by a heat map. Under any of the given abiotic stress conditions, genes that exhibited ≥ 2-fold differential expression are shown (A). Real-time PCR were performed on these genes (B-E). The significance of difference between the controls and treatments are determined by using Origin 7.5, and are represented by two asterisks (**P < 0.01) and one asterisk (*0.01 < P < 0.05). The color scale (representing average log signal values) is shown at the bottom.
