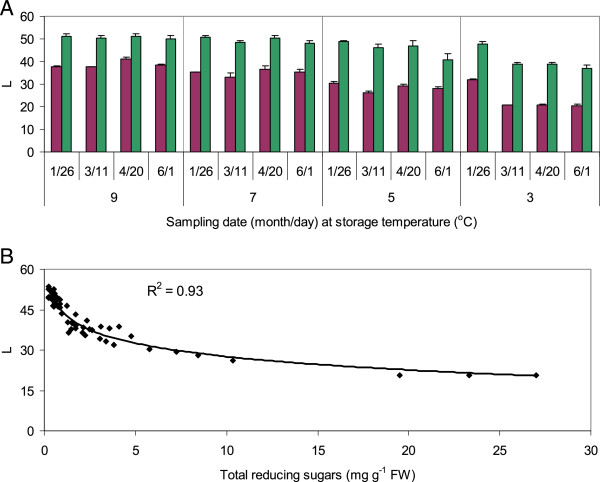
Figure 2.

Chip colors and correlation with sugar contents. Average L-values of chips (A) and correlation of L-values with reducing sugar contents (B) from tubers stored through June at 3, 5, 7, or 9°C. Purple bars represent WT tubers; green bars, RNAi tubers. Values are the averages of two samples of WT and six samples of RNAi lines ± standard error; each sample is comprised of three chips from each of six tubers. Tubers were harvested on October 1, 2010 and sampled in 2011. Higher L-values correspond to lighter chip color.
