
Figure 3. MP-GAP controls cortical dynamics during mitosis and cytokinesis.
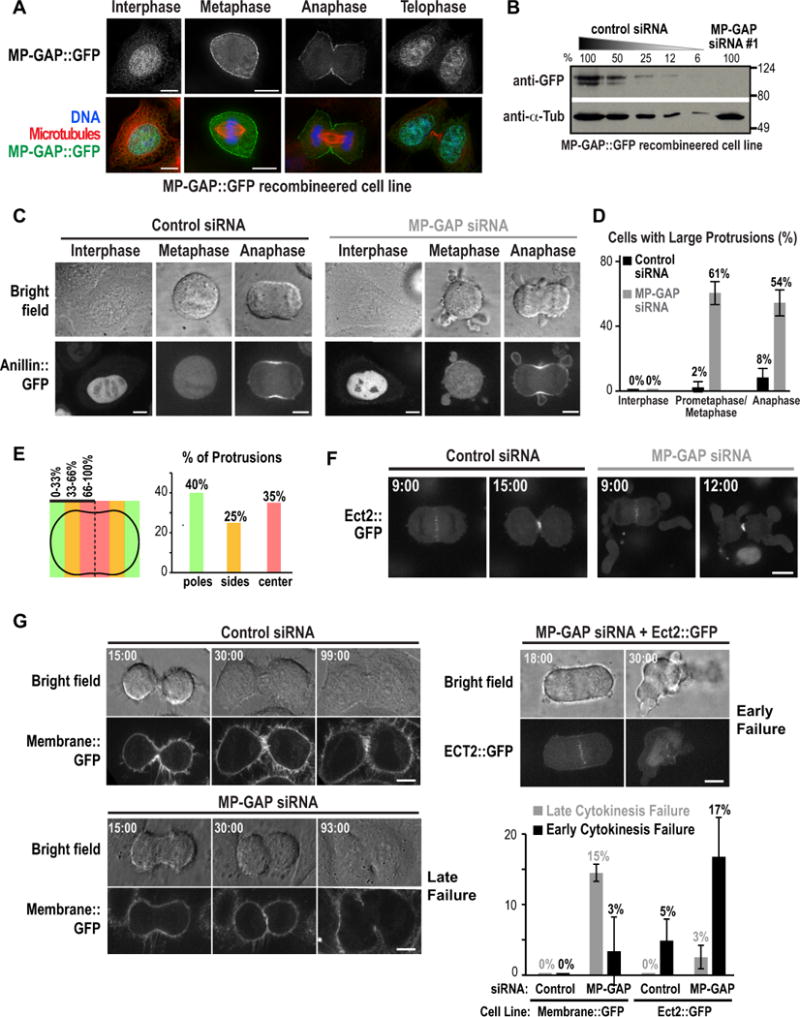
(A) HeLa cells expressing BAC-integrated MP-GAP::GFP fixed at different cell cycle stages and stained for DNA, GFP and microtubules. (B) Immunoblot of HeLa cells expressing BAC-integrated MP-GAP::GFP treated with MP-GAP siRNA#1 or a control siRNA for 48h. Serial dilutions of control cells were loaded to quantify depletion level. α-tubulin served as a loading control. (C) HeLa cells expressing BAC-integrated Anillin::GFP filmed starting 48 h after transfection with control or MP-GAP siRNA. Representative bright field (top) and confocal fluorescence (bottom) images are shown. (D) Graph of the percentage of cells with large protrusions in interphase (n=2 experiments), prometaphase/metaphase (n=7 experiments), and anaphase (n=7 experiments). Error bars are the SD. Total number of cells analyzed: control siRNA (55 interphase, 245 prometaphase/metaphase, 263 anaphase), MP-GAP siRNA (55 interphase, 140 prometaphase/metaphase, 140 anaphase). (E) Graph showing the spatial distribution of protrusions in early anaphase fixed cells stained for RhoA and DNA. (40 protrusions from 2 independent experiments). (F) Fluorescence confocal images of HeLa cells expressing BAC-integrated Ect2::GFP 48h after transfection with control or MP-GAP siRNA. Times are minutes after anaphase onset. (G) Representative brightfield and confocal fluorescence images of the indicated conditions from timelapse imaging initiated ~8h after release from a thymidine block of HeLa cells expressing Membrane::GFP (MyrPalm:mEGFP) or Ect2::GFP. Times are minutes after anaphase onset. Graph shows percentage of early and late cytokinesis failure for each condition. Error bars are the SD of 2 (Membrane::GFP) or 3 (Ect2::GFP) independent experiments. The total number of cells analyzed was: Membrane::GFP (95 control siRNA, 90 MP-GAP siRNA); Ect2::GFP (179 control siRNA, 159 MP-GAP siRNA). Bars, 10μm. See also Figure S3.