
Figure 6. MP-GAP mediated RhoA flux specifies RhoA zone dimensions when the centrosomal microtubule asters are absent.
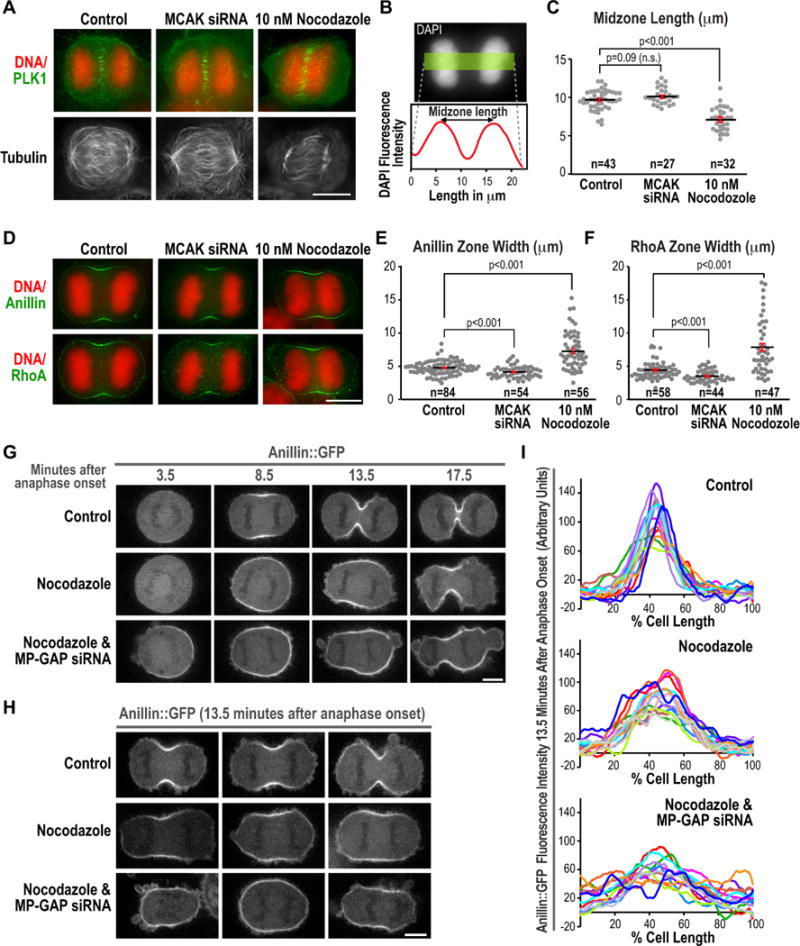
(A) Immunofluorescence images of control, MCAK siRNA, and low dose nocodazole-treated cells stained for DNA, Plk1, and α-tubulin. (B) Measurement of midzone length from DNA fluorescence images of fixed early anaphase cells using a 50 pixel wide line scan and measuring the distance between the two peaks of DNA fluorescence intensity. (C) Graph of midzone length for control, MCAK siRNA-treated and low dose nocodazole-treated cells. n=number of cells scored. Error bars are the SEM. (D) Anaphase immunofluorescence images of cells treated as indicated and stained for DNA and RhoA. (E,F) Graphs plotting the width of the Anillin zone (E) and the RhoA zone (F) measured as described in Fig. 5C. n= number of linescans analyzed. p-values are the student’s t-test; error bars are the SEM. (G–H) Images of HeLa cells expressing Anillin::GFP. Representative timelapse sequences (G) or 3 images of cells ~13.5 minutes after anaphase onset (H) are shown for each condition. (I) Cortical Anillin::GFP fluorescence measured using a pole-to-pole linescan 13.5 minutes after anaphase onset. The average cortical fluorescence intensity at metaphase was subtracted from each value and the two linescans for each cell were averaged to generate each individual trace. Bars, 10 μm. See also Figure S5.