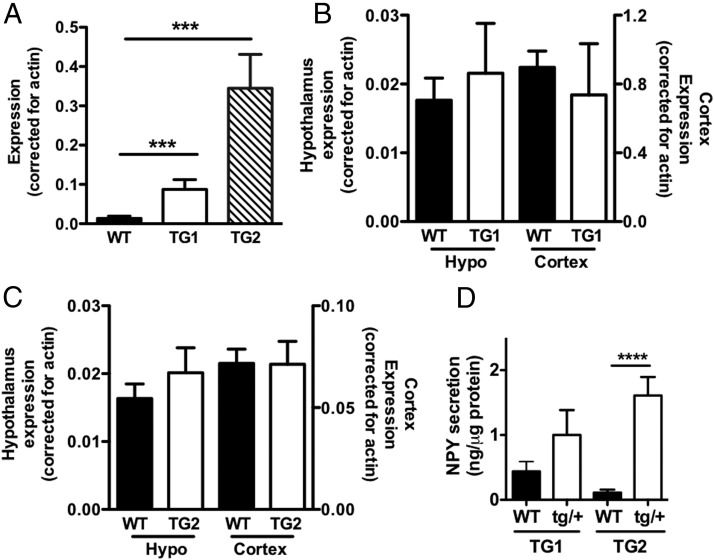
Figure 1.
Transgenic mice expressing NPY in β-cells. A, NPY expression was measured with quantitative PCR in islets of male NPY TG1 and TG2 in comparison with WT male littermates (WT), n = 3–11. B and C, NPY expression in hypothalamus (hypo) and cortex was compared between male WT, TG1 (n = 3 per genotype) (B), and TG2 mice (n = 6–8 per genotype) (C). D, NPY secretion from islets of male WT and NPY transgenic mice (tg/+) was expressed per islet protein contents (n = 3–7). Data are mean ± SEM. ***, P < .001; ****, P < .0001.

