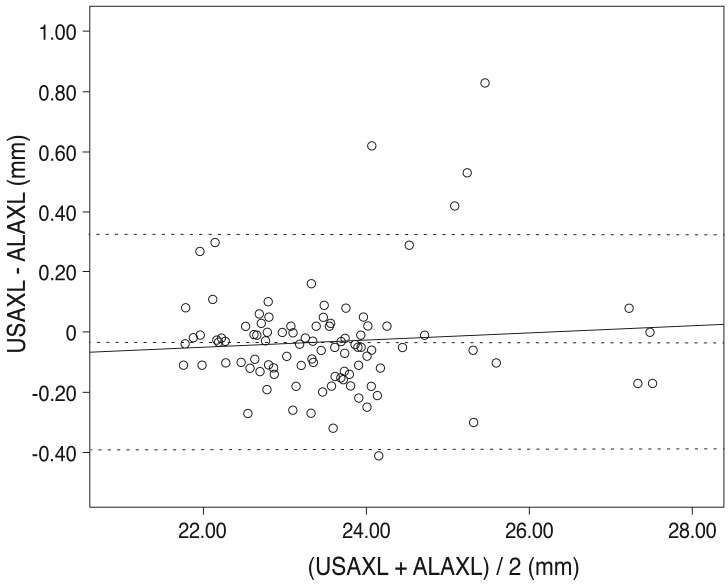
Fig. 2.
Bland-Altman plots for assessing agreement of pairs of two methods. y = 0.012 X - 0.317; mean = -0.0334 ; mean +2 SD = 0.32508 ; mean -2 SD = -0.39188. The solid line represents the average mean difference (-0.0334) and the dotted line represents the 95 percentile confidence interval. The slope of regression line is 0.012 and represents low error between two methods and high reliability. In the scatter plot, most values are on the dotted line (±1.96 SD, -0.3919 to 0.3251), suggesting good comparability. SD = standard deviation; USAXL = axial length measured with applanation ultrasound; ALAXL = axial length measured with AL-scan.

