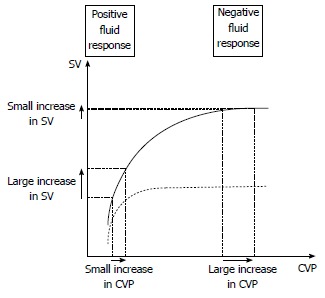
Figure 2.

Schematic representation of central venous pressure/stroke volume of normal (solid line) and failing heart (dotted line). When the heart is fluid responsive, a fluid challenge induces a large increase in stroke volume (SV) and a small increase in central venous pressure (CVP). When the heart is fluid unresponsive, a fluid challenge induces a small increase in SV and a large increase in CVP. In contrast, there is no reliable threshold of CVP that can be used in current practice to predict a positive or negative response to fluid loading. This threshold depends mostly on the cardiac function at the time of fluid infusion.
