
Figure 4.
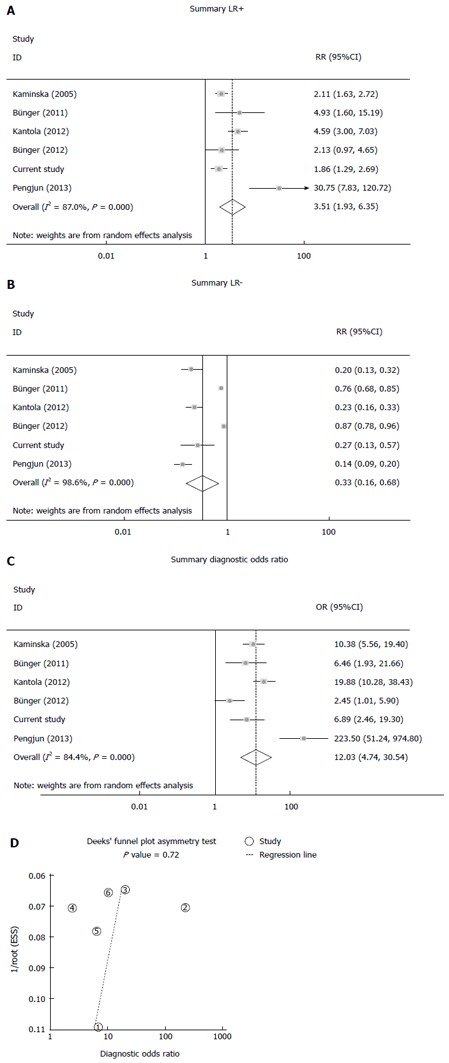
Positive likelihood ratio, negative likelihood ratio, diagnostic odds ratio and Deek’s funnel plot. A: Positive LR; B: Negative LR; C: Diagnostic OR; D: Deek’s funnel plot asymmetry test. LR: Likelihood ratio; OR: Odds ratio.
Official websites use .gov
A
.gov website belongs to an official
government organization in the United States.
Secure .gov websites use HTTPS
A lock (
) or https:// means you've safely
connected to the .gov website. Share sensitive
information only on official, secure websites.
Positive likelihood ratio, negative likelihood ratio, diagnostic odds ratio and Deek’s funnel plot. A: Positive LR; B: Negative LR; C: Diagnostic OR; D: Deek’s funnel plot asymmetry test. LR: Likelihood ratio; OR: Odds ratio.