FIGURE 8.

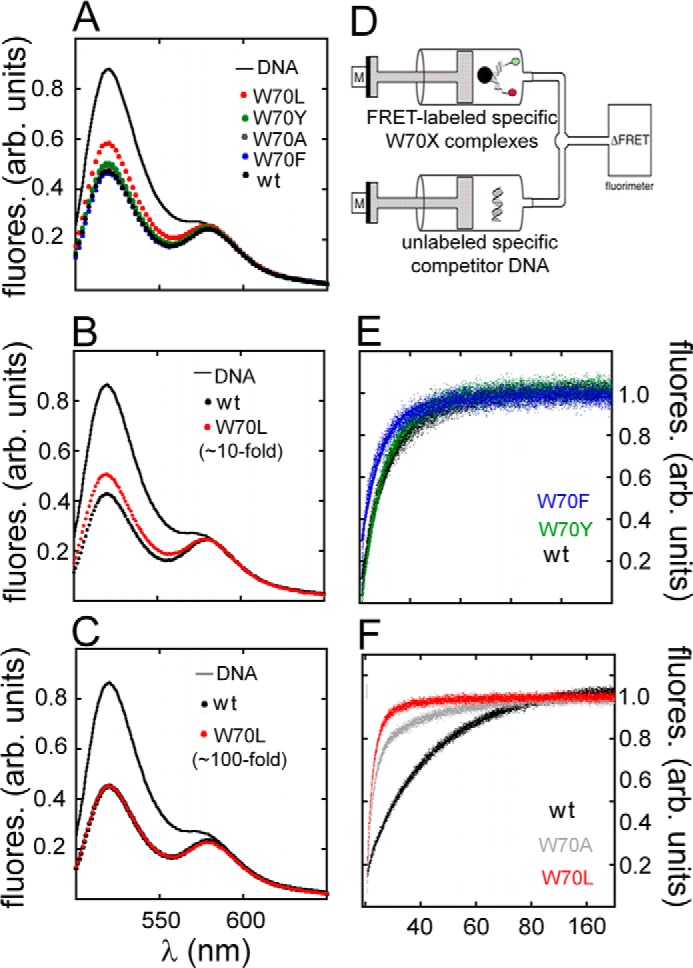
FRET-based studies of specific DNA binding. A–C, emission spectra of donor/acceptor-labeled DNA in free and protein-bound states following excitation at 490 nm. A, spectra of free DNA (solid black line) and DNA bound to WT (black filled circles) or W70 variants (color code inset). Overlapping spectra were observed except for the W70L domain·DNA complex (red) due to its partial dissociation under these conditions. B and C, comparison of FRET spectra of the W70L·DNA complex at a nominal concentration of 3 μm (B) versus an effective concentration of 30 μm (C). At the latter concentration (100-fold higher than the perturbed Kd) FRET efficiency is indistinguishable from that of WT (C). D, stopped-flow FRET assay. Stopped-flow apparatus coupled to the fluorimeter and experimental design to measure dissociation of the SRY·DNA complex. One syringe contained preformed SRY-labeled DNA complex; a second syringe contained unlabeled DNA in 20-fold excess. E and F, time-dependent increase in donor fluorescence (6-FAM) due to dissociation of 6-FAM/TAMRA-labeled DNA·SRY complexes. E, dissociation reactions of the aromatic variants W70F (blue) and W70Y (green) relative to WT (black). F, W70A (gray) and W70L (red) relative to WT (black) at 15 °C. Measurements were taken for 180 s until plateau was reached. Dissociation rate constants (koff) were based on a mono-exponential fitting values in Table 5. fluores. (arb. units), fluorescence arbitrary units.
