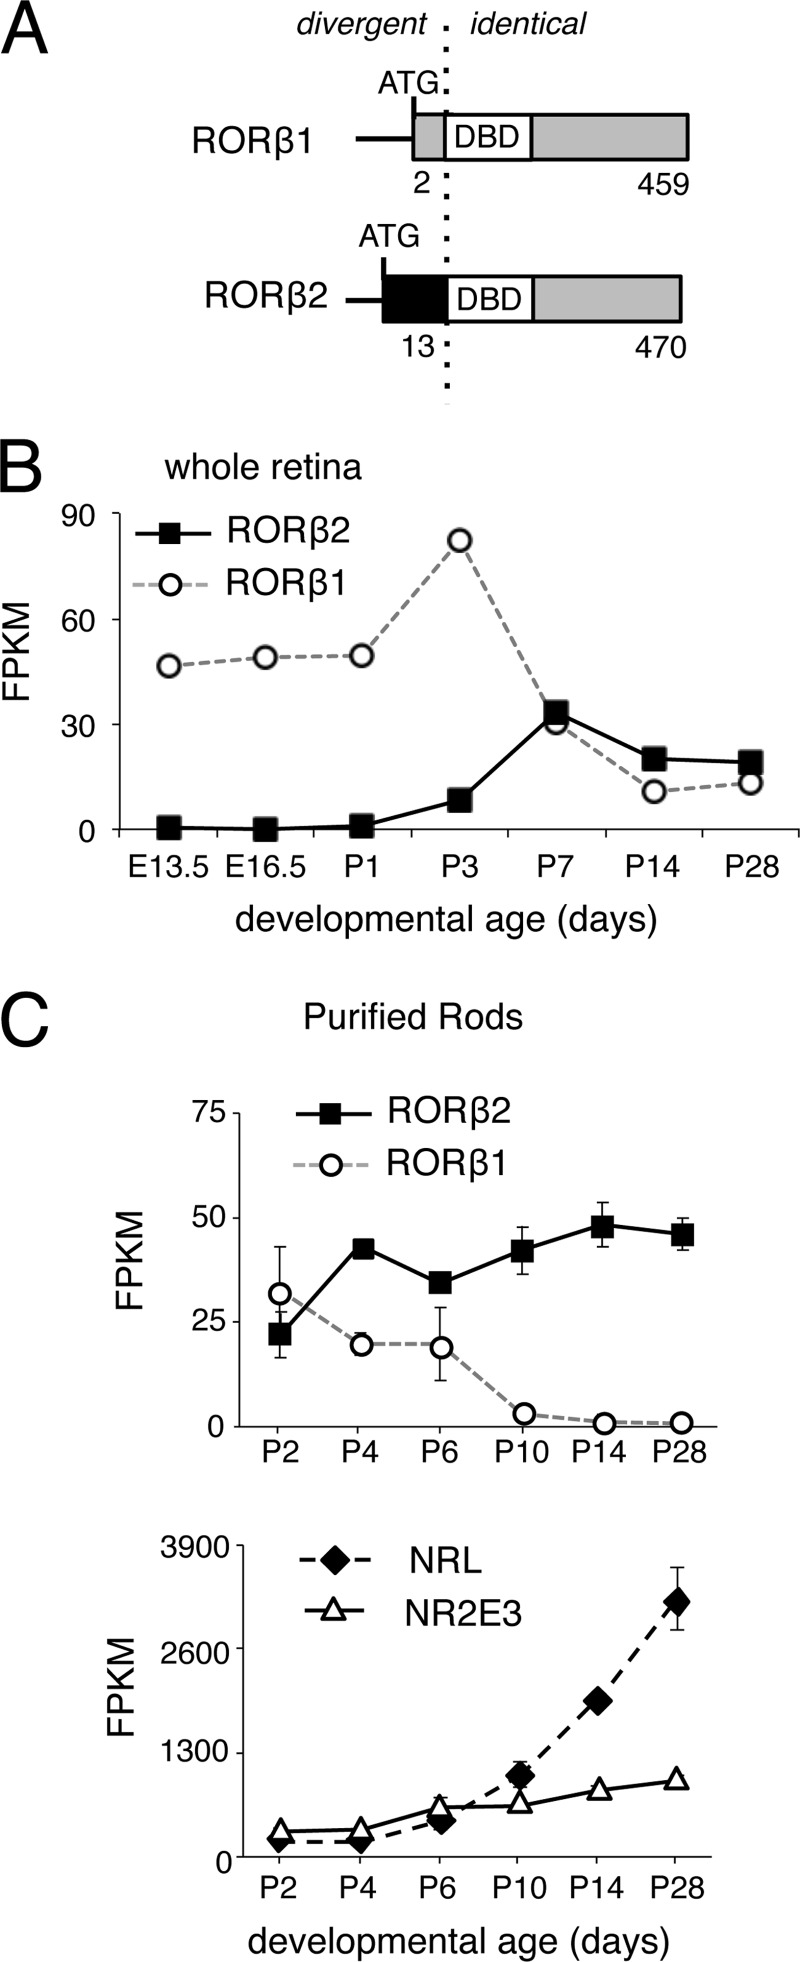
FIGURE 1.
Differential temporal expression of RORβ isoforms. A, diagram of RORβ1 and RORβ2 isoforms showing the divergent N termini but identical DNA binding domain (DBD) and C terminus. The numbers refer to amino acid coordinates. B, expression profiles of RORβ1 and RORβ2 mRNA during retinal development, determined by RNA sequencing analysis of whole retina. RNA samples represented pooled retinas (from more than three mice) at each time point. FPKM, fragments per kilobase of transcript per million mapped reads; E13.5, embryonic day 13.5. C, expression profiles of RORβ1 and RORβ2 mRNA in rod photoreceptors, determined by RNA sequencing analysis of purified rod photoreceptors from Nrlp-GFP transgenic mice at the ages shown. The expression of NRL and NR2E3 rod factors rose over this period.

