
FIGURE 6.
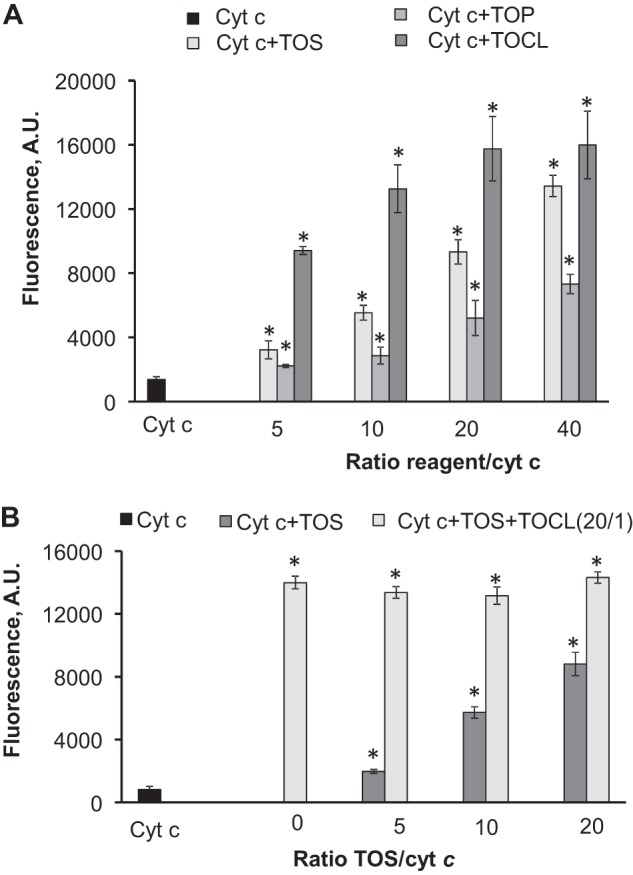
Peroxidase activity of cytochrome c triggered by α-TOS and α-TOP assessed by H2O2-induced oxidation of Amplex Red. A, comparison of TOCL, α-TOS, and α-TOP as activators of peroxidase function of cytochrome c. B, effect of simultaneous addition of α-TOS and TOCL on peroxidase activity of cytochrome c. Dark gray columns correspond to the samples containing TOS only, light gray columns represent the samples containing different amounts of TOS plus TOCL (constant amount) thus yielding the same ratio of TOCL/cytochrome c, 20:1, but varying ratios of TOS/cytochrome c (cyt c). Measurements were performed in 20 mm HEPES buffer (pH 7.4) with 100 μm DTPA; the concentration of cytochrome c was 1 μm, concentrations of Amplex Red and H2O2 were 50 μm. Samples containing cytochrome c, Amplex Red, and H2O2 were used as a control. n = 6 experiments; *, p < 0.05 versus cytochrome c.