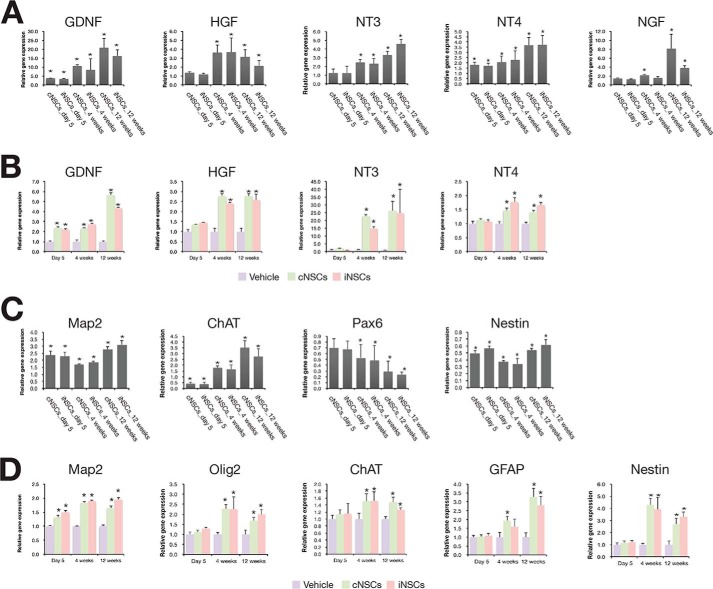
FIGURE 6.
Time course gene expression analysis of neurotropic and neuronal markers. A and B, expression pattern of neurotropic factors in the transplanted cells (A) and in the host environment (B). C and D, expression pattern of neuronal markers in the transplanted cells (C) and in the host environment (D). Expression levels of each marker gene were analyzed at 5 days and at 4 and 12 weeks post-transplantation by qRT-PCR. The expression levels of each marker were normalized to those of cultured cNSCs or iNSCs (A and C) and those of vehicle control (B and D). Error bars indicate standard deviation of triplicate values. *, p < 0.05.

