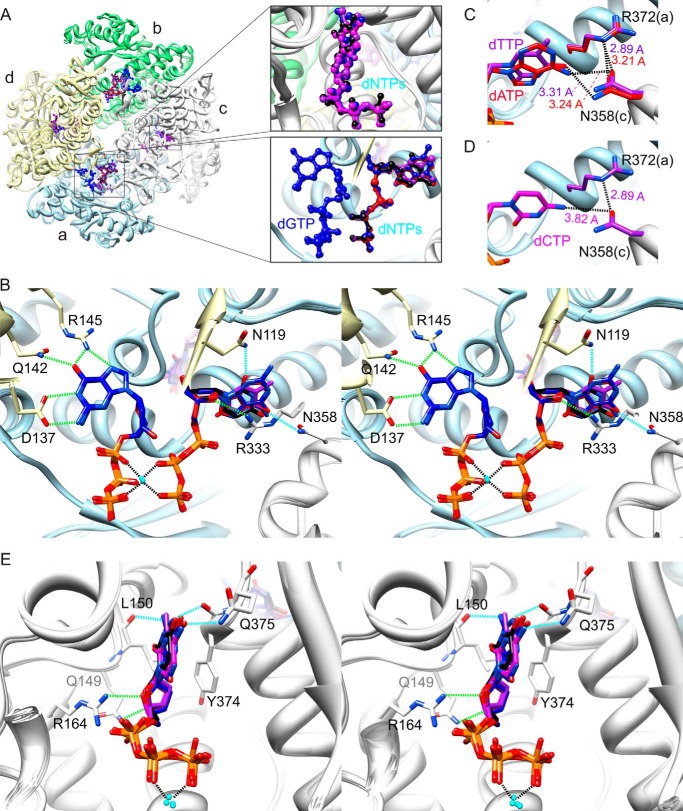
FIGURE 1.
Crystal structures of SAMHD1c-dGTP/dATP, SAMHD1c-dGTP/dCTP, SAMHD1c-dGTP/dTTP, and SAMHD1c-dGTP/dUTP. A, superposition of SAMHD1c structures for different dGTP/dNTPs. The four monomeric subunits (a–d) in each SAMHD1c tetramer are displayed in a ribbon representation and are colored in light blue, light green, light gray, and light yellow, respectively. The tetramer is formed by two dimers, composed of subunits a and d and subunits b and c. The dGTP, dATP, dCTP, dTTP, and dUTP molecules are shown in a ball-and-stick representation and colored in blue, red, magenta, purple, and black, respectively. The different dNTPs occupying the allosteric site between subunits a, c, and d (top right panel) and the catalytic site of subunit c (bottom right panel) are also shown in a magnified view in the inset. B, stereoview of detailed hydrogen bond interactions in the allosteric sites for the superimposed structures of SAMHD1c with different dNTPs. As in A, the overall protein structure is shown in a ribbon representation and colored in light blue, light green, light gray, and light yellow for subunits a, b, c, and d, respectively. The dGTP molecules are shown in a stick representation with the carbon atoms colored in dark blue and other atoms in blue (nitrogen), red (oxygen), and orange (phosphor). Interacting residues are also shown in a stick representation with carbon atoms colored in the corresponding chain color and oxygen and nitrogen atoms colored in red and blue, respectively. dNTP molecules in the secondary allosteric site are also displayed in a stick representation, with the carbon atoms colored in red, magenta, purple, and black for dATP, dCTP, dTTP, and dUTP, respectively, and other atoms in blue (nitrogen), red (oxygen), and orange (phosphor). Conserved and non-conserved hydrogen bonds are represented by dashed green and cyan lines, respectively. C, hydrogen bonds between the base moiety of dTTP and dATP and the protein in the secondary allosteric site. The distances between the O4 of dTTP and the ND2 of Asn-358 and between N6 of dATP and the ND2 of Asn-358 are ∼3.31 and 3.24 Å, respectively. D, model illustrating why dCTP is not found in the second allosteric site. The dCTP molecule was modeled, based on the electron density of dTTP in the SAMHD1c-dGTP/dTTP complex. The distance between N4 of dCTP and OD1 of Asn-358 is ∼3.82 Å, too far for optimal hydrogen bonding. Note that OD1 of Asn-358 forms a hydrogen with to Arg-372, with distances ranging from 2.89 to 3.21 Å in all structures. E, stereoview displaying detailed hydrogen-bond interactions between the different dNTPs and residues in the catalytic site. Coloring is as in B.

